Quality performance monitoring should be an essential component of any solar energy system, but is sometimes the first thing to be sacrificed in the name of cost-savings. New Zealand’s SPLASH Monitoring is a company who has made it a mission to turn this often overlooked feature into the centerpiece of any installation. SPLASH’s attractive, interactive and comprehensive monitoring platform is used in dozens of solar projects across Australia, New Zealand and beyond.
Why monitor?
SPLASH Technical Director Ian Sumner says that there are two fundamental reasons for monitoring solar systems:
- To provide education and raise awareness of systems and technologies that often do their work outside of the public eye; and
- To manage solar systems and ensure that they perform to expectations.
“Solar systems are generally invisible,” he notes. “SPLASH makes systems visible, engaging and easy to understand, raising awareness and stimulating conversations not only around solar PV but of energy consumption and conservation.
“Furthermore, over time many solar installations develop faults or perform below expectations, Monitoring makes system performance visible and understandable allowing systems to be managed and ensuring systems perform as intended”
For monitoring renewable energy system performance at home, work or school
SPLASH was initially developed in 2007 to raise awareness and provide education around solar water heating systems in schools. In 2009, SPLASH developed its first solar PV monitoring system and is now used to monitor and manage many different technologies. The SPLASH platform can be used in any residential, commercial or educational setting, but is a favourite for destinations where visitor traffic is high and displaying system performance is important.
Notable installations which use SPLASH’s platform include the Auckland War Memorial Museum, Auckland’s SkyCity Hotel, Victoria University in Wellington, the Auckland Cancer Society’s Domain Lodge, and the Australian National Golf Course. Additionally, many supermarkets, local and central government buildings, schools, commercial premises, and homes use the SPLASH platform to ensure their systems are performing to expectations and to show off their solar system’s performance.
2014 saw the release of the SPLASH “Easy View” which provides an easy way to visualise current and historical energy generation and or consumption in commercial and residential buildings. The “Easy View” is so effective that it is being used in trials by power companies to provide education and awareness of energy consumption and to change behaviour.
SPLASH Monitoring features
SPLASH’s monitoring platform offers a range of features that include everything from the visually appealing to the eminently practical. They include:
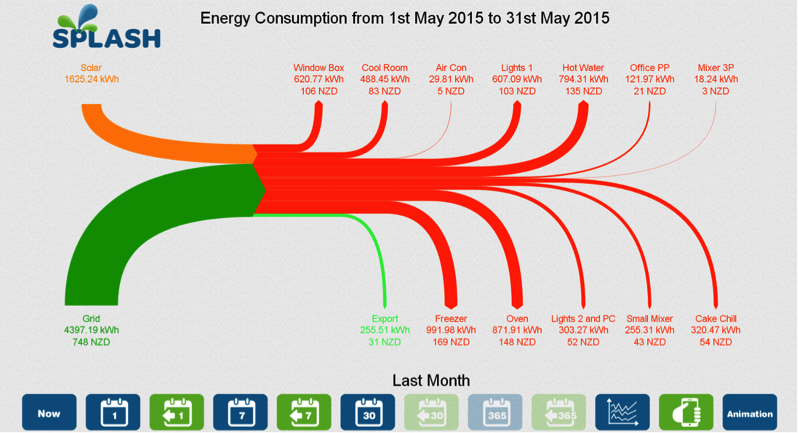
- Lobby screen presentation for high-visibility display: SPLASH’s colour-rich, animated monitoring interface is ideal for placement in the lobbies and atriums of schools, office buildings and museums. Some examples are included below.
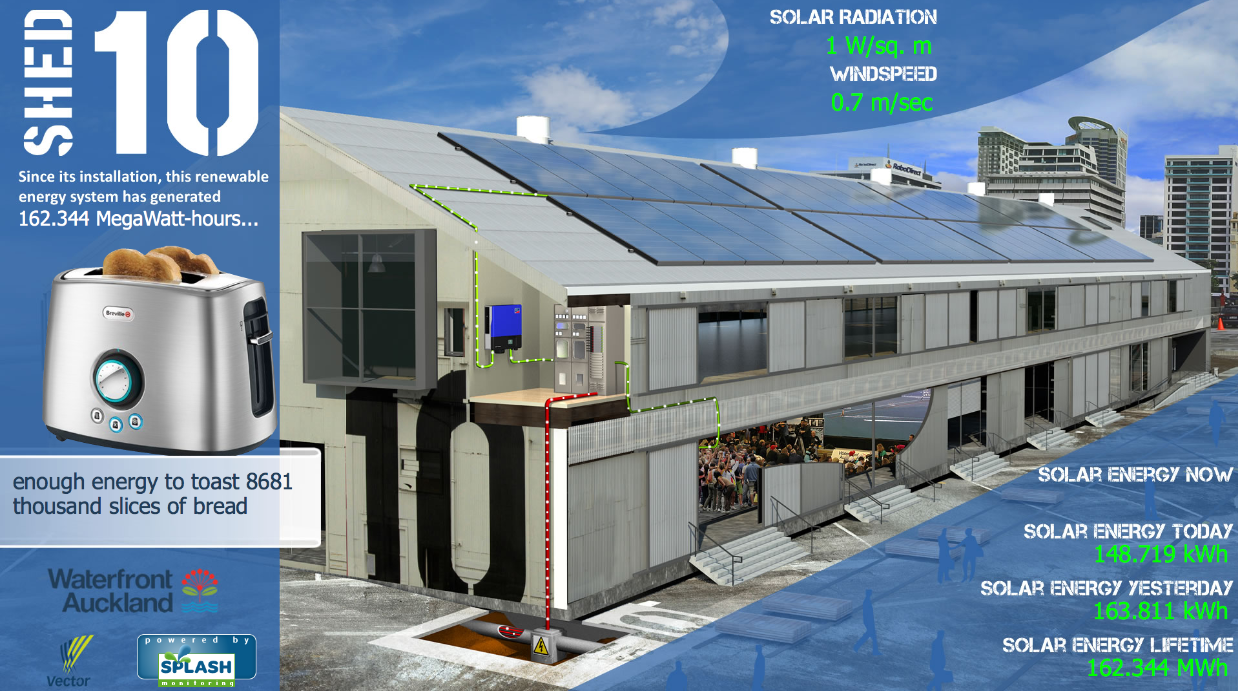
SPLASH Monitoring interface for Shed 10 at Aucland’s Queens Wharf waterfront area
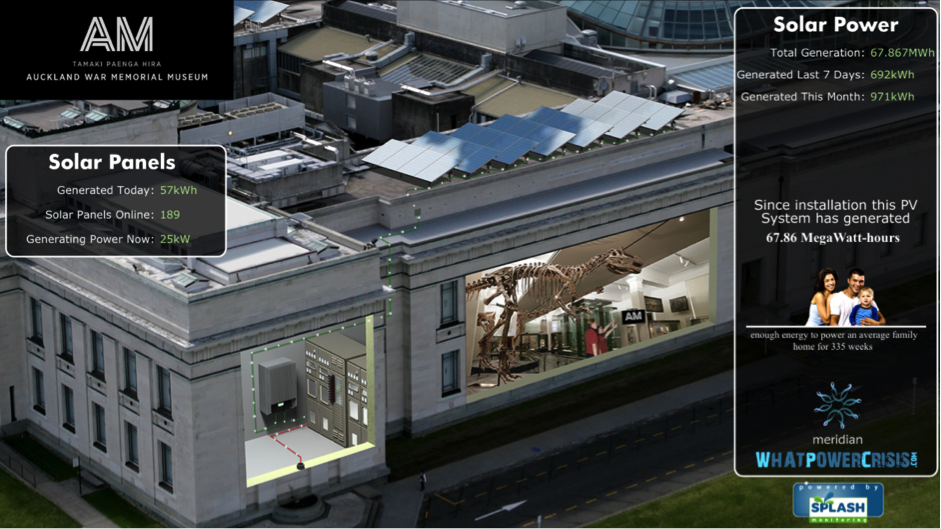
SPLASH Monitoring interface for the Auckland War Memorial Museum
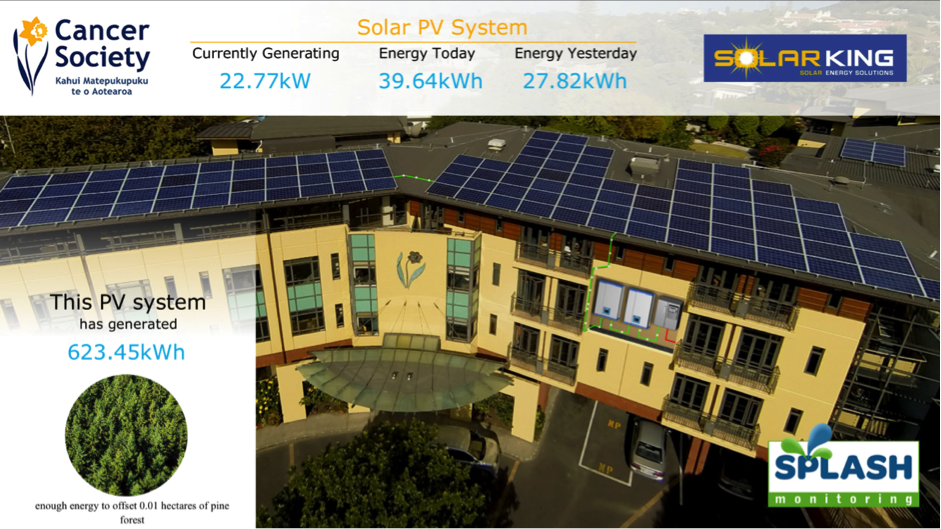
SPLASH Monitoring interface for the Auckland Cancer Society
- Detailed animations which bring the flow of energy to life – in real-time: Animations can be customised with photos from the site itself, or the system owner can choose from a range of 70+ stock animations. Adding sensors to individual components can heighten the degree of accuracy – so that anyone can tell at a glance when a light or television is switched on.
- SPLASH System Manager: Ideal for solar system installers and managers, the System Manager interface provides a tabular list of all of the user’s installations with a summary of their performance in real time. It also includes green and red light indications that the system is performing to expectations or has developed a fault, plus a historic fault log. This feature is ideally suited for those to managing large numbers of systems – such as rooftop solar PPA providers.
- Performance Comparisons: The actual power generation of the system is regularly compared to the predicted generation to ensure that systems are performing to expectations.
- Weekly or monthly overview and performance reports: System owners and managers can opt to be emailed weekly or monthly performance reports. These provide an overview of the system’s performance, including any faults that have arisen in that time. Several graphs are included that compare the monthly and cumulative annual generation to allow owners and managers to easily review system performance.
- SMS and email alerts can be sent out to notify system owners and managers of a fault or problem, thereby allowing system performance to be continually optimised.
- Data is updated in 10-second intervals for high levels of granularity and to allow lobby screen animations to change regualarly.
- Historic system performance data is logged and can be graphed using a powerful and flexible graphing system. Graphs can be used for display, educational or troubleshooting purposes.
- Installation is straightforward, quick and affordable – SPLASH is compatible with all types and brands of inverters. Comprehensive data can also be extracted from the most popular inverters.
- Displays can be branded with any logo, providing marketing opportunities for system suppliers and owners alike.
- SPLASH Power Monitoring with “Easy View”: The SPLASH Power Loggers each monitor up to 12 circuits, larger installations can be monitored by installing multiple loggers. For more information on SPLASH Power Monitoring, see their Power Montioring brochure (pdf)
SMASH Monitoring contact details
Ian Sumner, Technical Director
Email: ian@splashmonitoring.com
Download a brochure (PDF)
© 2015 Solar Choice Pty Ltd