Having just published an article on the state of Australia’s battery storage market at the beginning of 2017 (recently updated), we decided we would endeavour to shed a bit more light on payback period differences between each capital city. Which cities have the best conditions for home solar battery storage? We’ve ranked them below (with an explanation of our process & assumptions at the bottom of this article).
Please note that payback periods for solar systems on their own (without batteries) are generally still much shorter than solar + battery systems in Australia (see here), mainly due to the price of battery storage – which remains high. As of now, we recommend batteries mainly to people who are focused on energy independence and lower energy bills, but they do not yet make great sense as an investment decision.
Note: This article is from 2017. Please see our updated article for 2018 here.
That being said, we’ve seen a ton of interest in battery storage from our customers, and as such have put together this ranking of capital cities based on their battery-friendliness.
This article was originally published in February 2017. It was last updated on 7 August 2017 to take into account changing grid electricity prices, solar feed-in tariff rates, battery installation prices and solar PV system installation prices.
Compare solar & battery storage quotes from installers in your area!
Compare Solar & Battery Quotes
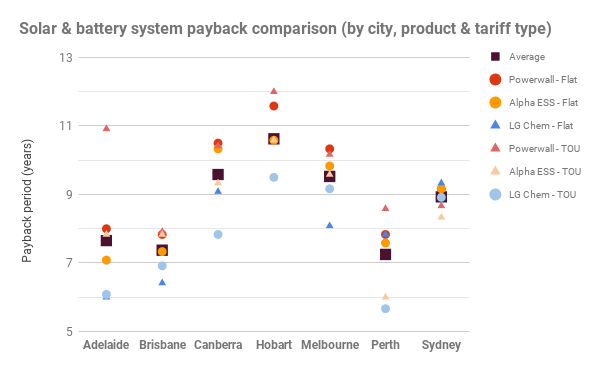
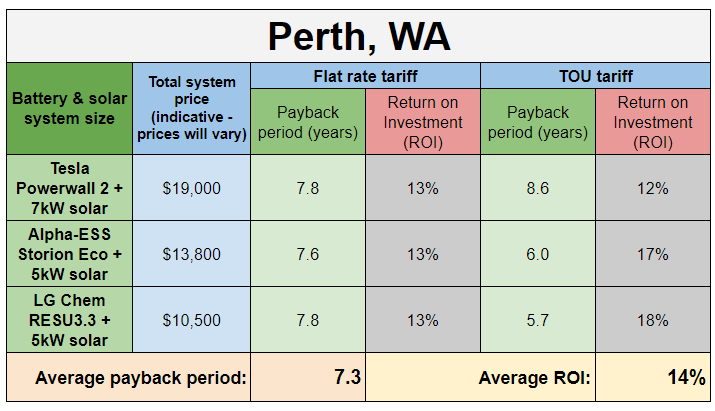
1. Perth – 7.3 years average payback
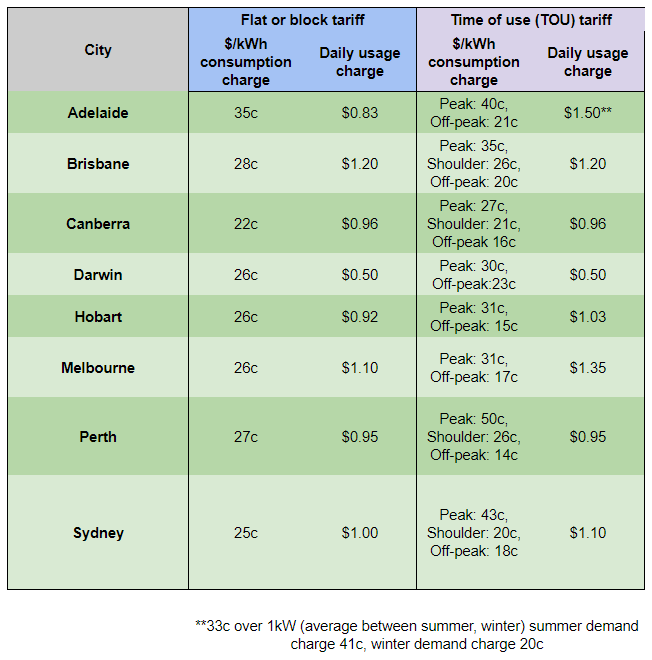
- Flat rate tariff details: 27c/kWh
- TOU tariff details: Peak – 50c/kWh, Shoulder – 26c/kWh, Off-peak – 14c/kWh
- Assumed feed-in tariff rate: 8c/kWh
Perth was the best overall city for solar battery storage, thanks to low solar system prices, high grid electricity prices and ample sunshine. The payback period was shortest for the smallest battery system on a TOU tariff, coming in at an impressive 6 years.
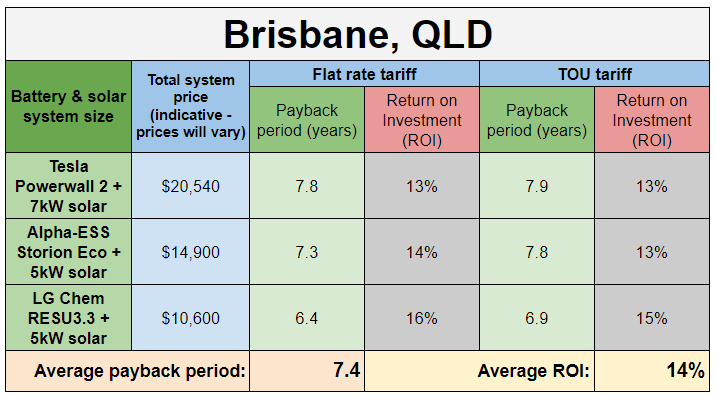
2. Brisbane – 7.4 years average payback
- Flat rate tariff details: 28c/kWh
- TOU tariff details: Peak – 35c/kWh, Shoulder – 26c/kWh, Off-peak – 20c/kWh
- Assumed feed-in tariff rate: 10c/kWh
High electricity costs coupled with competitive solar installation prices also helped to make battery storage attractive in Brisbane. The average payback period for the city was 7.4 years, but this could go down as low as 6.4 for ‘small’ battery system owners on a flat rate tariff.
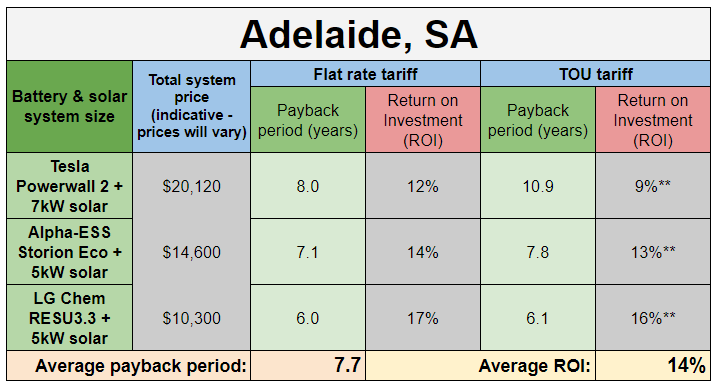
3. Adelaide – 7.7 years average payback
- Flat / block rate tariff details: 35c/kWh
- TOU tariff details: Peak – 40c/kWh, Off-peak – 21c/kWh (plus summer demand charge of 41c/day and winter demand charge of 20c/day for grid demand over 1kW)
- Assumed feed-in tariff rate: 7c/kWh
Solar & battery system paybacks were on average just under 8 years, with flat rate tariff customers having shorter paybacks than TOU customers based on our initial assessment. However, paybacks on TOU systems could be shorter if associated demand charge savings are also taken into account (our modelling assumes customers will pay the demand charge every day, but the system may help them to avoid this charge). Additionally, residents of Adelaide’s downtown area may be eligible for battery system rebate of up to $5,000 depending on their situation, which will shorten paybacks further.
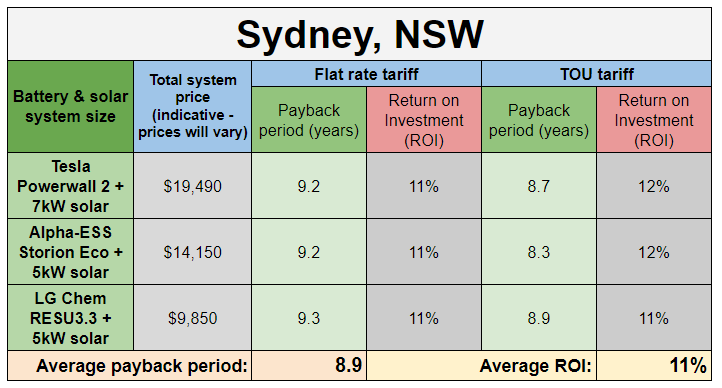
4. Sydney – 8.9 years average payback
- Flat rate tariff details: 25c/kWh
- TOU tariff details: Peak – 43c/kWh, Shoulder – 20c/kWh, Off-peak – 18c/kWh
- Assumed feed-in tariff rate: 10c/kWh
While 9 years appears to be the average payback period for a solar & storage system in Sydney, the shortest payback that popped up in the results was 6 years for a small battery bank on a TOU tariff.
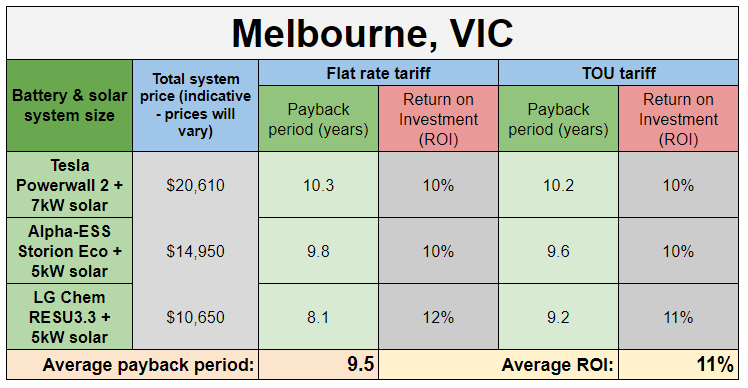
5. Melbourne – 9.5 years average payback
- Flat rate tariff details: 26c/kWh
- TOU tariff details: Peak – 31c/kWh, Off-peak – 17c/kWh
- Assumed feed-in tariff rate: 12c/kWh
Solar system prices for Melbourne are slightly higher than the previous four cities listed in this ranking, due in part to the smaller incentive available through the federal Renewable Energy Target (which is in turn due to the smaller amount of sunshine that falls on Melbourne on average throughout the year).
That being said, electricity rates in Victoria’s capital are still about as high as they are in Sydney, Brisbane & Perth, making solar a worthwhile investment on its own, and increasingly attractive for solar + battery systems as well.
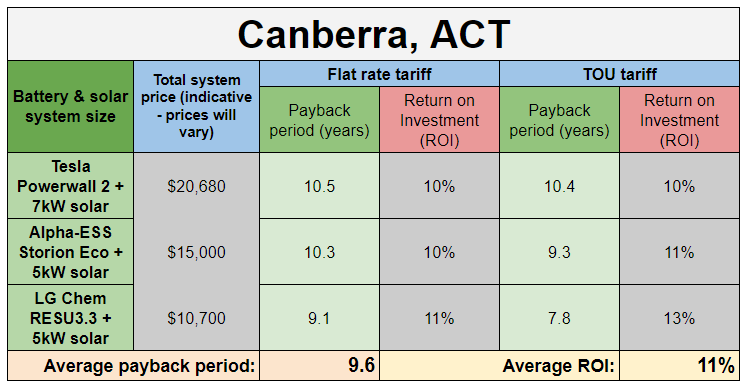
6. Canberra – 9.6 years average payback
- Flat rate tariff details: 22c/kWh
- TOU tariff details: Peak – 27c, Shoulder – 21c, Off-peak – 16c
- Assumed feed-in tariff rate: 11c/kWh
Grid electricity prices have recently increased in Canberra, bringing the investment case for solar & batteries into line with much of the rest of the nation. Although the average payback period for our analysis was just under 10 years, it’s important to keep in mind that we have not taken into account discounts available under the ACT’s NextGen incentive program for energy storage, which will subsidise battery installations (among other types of storage) for thousands of households.
Even before subsidies, batteries are already beginning to look attractive for homes on TOU tariffs who opt for a smaller system, with paybacks around the 8 year mark.
If you live in Canberra, do your research to understand how the incentive program will affect the payback period for the system that you buy – you may find the results are significantly rosier than those detailed in the table below.
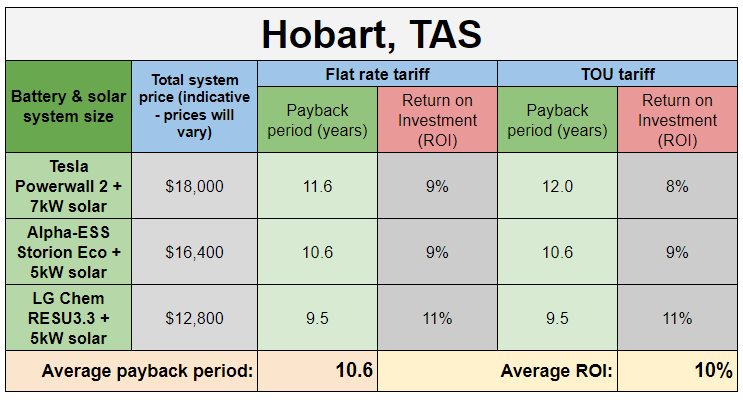
7. Hobart – 10.6 years average payback
- Flat rate tariff details: 26c/kWh
- TOU tariff details: Peak – 31c, Off-peak – 15c
- Assumed feed-in tariff rate: 9c/kWh
In spite of being the least sunny capital city and having some of the highest solar prices, batteries are beginning to make sense even in Australia’s least sunny capital, with an average payback period of just under 11 years for solar & storage systems. High electricity rates go a long way towards explaining why this is the case.
8. Darwin – Don’t get batteries*
- Flat rate tariff details: 26c/kWh
- TOU tariff details: Peak – 30c/kWh, Off-peak -23c/kWh
- Assumed feed-in tariff rate: Equal to retail tariffs (Assuming 26c/kWh for flat-rate customers, 30c/kWh for TOU customers. Note that under TOU customers are actually paid the off-peak rate between 6pm and 6am, but due to limitations in PVSell we have only used the peak rate.)
Despite the fact that Darwin is Australia’s sunniest capital – and the only one located in the tropics – the incentives for solar system owners in the state mean that batteries do not make any financial sense at all.
Here’s why: In every capital city besides Darwin, sending solar into the grid will net a solar system owner only about 8c/kWh (approx). This is significantly lower than the rate that customers pay for electricity from the grid; someone with a solar system would save more money by using the solar energy directly (‘solar self-consumption‘), thereby reducing their electricity bill by avoiding the purchase of expensive grid electricity (about 25c/kWh in most places).
But most solar system owners cannot use all of their solar energy during the daylight hours, and inevitably have ‘excess’ energy. Batteries allow them to ‘save’ their solar energy for use later in the day, when they’re more likely to use it (e.g. around dinner time, after the sun has gone down). By doing so, they save about 17c/kWh (the difference between the feed-in rate and their retail rate).
The smaller the difference between the feed-in tariff rate and the consumption rate, the less value that batteries offer. For Darwin customers, there is no difference between the feed-in rate and the consumption rate. This means that there is virtually zero opportunity to save money by installing batteries. Furthermore, because batteries are not 100% efficient, it’s almost inevitable that you will lose money for every kWh of solar energy that you ‘shift’ for later use via your batteries.
Key takeaway: All in all, in Darwin the payback period will be longer for a solar + battery system than it will for a solar only system – even if you spend the same amount of money (e.g. $18,800) on the system. Until the feed-in tariff rate drops, batteries will make no sense for Darwin customers.
*N.b. An earlier version of this article incorrectly assumed that the solar feed-in rate for Darwin customers was 8c/kWh. In reality, the rate is equivalent to the retail tariff rate at time of export.
Important caveats about these results
The payback period and returns for a given solar + battery storage system will depend on the exact circumstances of the home in question. The conclusions we’ve drawn here (using SunWiz’s PVSell software) are based on only a handful of scenarios and are meant to act as a bellwether for the viability of battery storage in Australia’s capital cities. Also keep in mind that we’ve also left out incentives available in Adelaide, the ACT and parts of WA – which could make a big difference in reducing payback times and increasing the attractiveness of a battery storage investment.
Solar Choice has a number of free, handy tools that allow you to delve into the details a bit more yourself, including our Solar & Battery Storage System Sizing & Payback Estimator. The results from this and other tools we offer will allow you to roughly work out what size system would best work for your home – putting you in a good position to assess quotes and initiate a discussion with installers.
Remember – in the end, a system that is customised for your home & habits will deliver the best value and greatest possible savings. When looking at the results below, keep this fact in mind and see if you can find better outcomes for yourself!
Assumptions used
| Scenario assumptions | |
| Energy consumption: | 30kWh/day |
| Energy usage pattern: | ‘Day focus’ (homes with young children or a home office) |
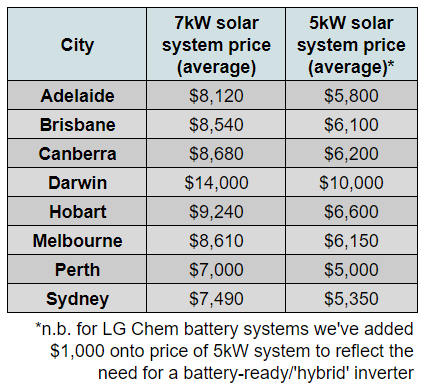
| Solar system prices: | Average for each capital city as of August 2017 (see table below) |
| Battery system installation prices: | Same for each city (see table below). Battery systems were chosen for their size (small, medium, large), relative affordability & similar performance specs. Actual prices will vary with installer & location. |
| Electricity rates: | Best rates available for each city (as found on EnergyMadeEasy.gov.au – checked & updated in Aug 2017) |
| Solar feed-in rates: | We also checked EnergyMadeEasy.gov.au for solar feed-in rates in each city (rates checked & updated in Aug 2017).
Note that feed-in rates for Adelaide systems were modelled at ‘0c/kWh’ for the Powerwall & Alpha ESS options due to restrictions expected to be imposed by SA Power Networks for systems with total inverter capacity over 5kW. |
| Battery charging type: | Solar charging only (no charging with grid) |
| Battery discharge settings: | Discharge whenever needed (i.e. benefits of tariff arbitrage on TOU tariffs not accounted for in calculations) |
| Battery degradation: | Not accounted for in calculations |
| Battery incentives (ACT, Adelaide, WA): | Not accounted for in calculations |
| Purchase type: | Results are all based on the assumption that the systems are purchased with cash (no financing), with both solar & battery components of the system being purchased at the same time (no battery retrofits) |
Electricity tariff details by city (flat & time of use tariffs):
Average solar system prices for each city as of August 2017:
Assumed battery storage prices (actual prices will vary with installer and location):
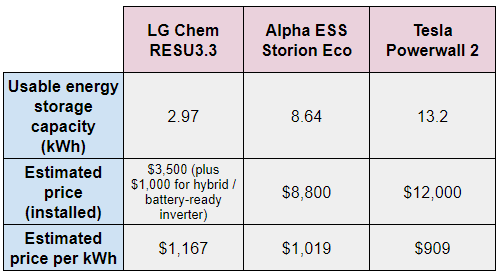
Detailed results by battery product:
Tesla Powerwall 2
Alpha-ESS Storion Eco
LG Chem RESU3.3
Check out these useful resources:
Compare solar & battery storage quotes for your area
Compare Solar & Battery Quotes
Learn more about battery storage: Check out our Battery Storage 101 page
Try our Solar & Battery Storage Sizing & Payback Estimator Tool or our Battery Retrofit Sizing Estimator Tool
Check out our Battery Storage Product Performance Comparison Tool
© 2019 Solar Choice Pty Ltd

He is now the communications manager for energy technology startup SwitchDin, but remains an occasional contributor to the Solar Choice blog.
James lives in Newcastle in a house with a weird solar system.
- Solar Hot Water System: Everything You Need to Know - 27 February, 2024
- Enphase Battery: An Independent Review by Solar Choice - 20 January, 2024
- Can I add more panels to my existing solar system? - 8 August, 2023
Can you do battery pay back etc. for Enphase batteries
Hi Dave – we’ve recently done an article about savings for Tesla’s Powerwall 2 and will do a similarly focused article for Enphase’s AC Battery as a next priority based on your request!
Are the payback times calculated on the entire system? (i.e. solar + battery vs nothing) or on the battery component (solar + battery vs solar only)
Hi Jonathon,
Yes, those are the paybacks for the system as a whole. Battery retrofits would have longer paybacks, while solar-only systems would have shorter ones.
Good idea for another topic, though – we’ll look into it.
Best,
James
It seems 7kW solar is cheaper than 5kW solar, or they are back to front.
Hi Jonathan. You’re correct – the numbers are in the wrong column. I’ve updated the chart to correct the problem. Thanks for pointing it out!
Is there a typo in your Melbourne graphic? It says $113,900 for Tesla!!!!
Thanks for spotting that, Andrew – we’ve just updated it.