Commercial Solar Panel Prices – May 2025
Average commercial system prices by city & size (May 2025)
| 10kW | 30kW | 50kW | 70kW | 100kW | |
|---|---|---|---|---|---|
| Adelaide, SA | $8,800 | $29,920 | $56,770 | $75,560 | $91,710 |
| Brisbane, QLD | $9,570 | $26,780 | $46,970 | $66,290 | $87,180 |
| Canberra, ACT | $9,970 | $38,960 | $54,800 | $70,220 | $99,920 |
| Hobart, TAS | $12,230 | $26,810 | $48,580 | $66,380 | $79,320 |
| Melbourne, VIC | $9,330 | $27,990 | $49,260 | $64,450 | $85,770 |
| Sydney, NSW | $8,820 | $25,910 | $46,400 | $62,970 | $82,880 |
| Perth, WA | $11,200 | $31,170 | $57,170 | $73,580 | $89,890 |
| All | $9,990 | $29,650 | $51,420 | $68,490 | $88,100 |
Request a free solar business case and compare leading commercial installers
Table 4: Average commercial solar panel prices per watt (May 2025)
| Average | 10kW | 30kW | 50kW | 70kW | 100kW | |
|---|---|---|---|---|---|---|
| Adelaide, SA | $0.95 | $0.78 | $0.94 | $1.06 | $1.02 | $0.92 |
| Brisbane, QLD | $0.89 | $0.91 | $0.82 | $0.93 | $0.95 | $0.87 |
| Canberra, ACT | $1.07 | $0.95 | $1.30 | $1.09 | $1.00 | $1.00 |
| Hobart, TAS | $0.90 | $1.07 | $0.84 | $0.92 | $0.89 | $0.75 |
| Melbourne, VIC | $0.94 | $0.91 | $0.93 | $0.98 | $0.92 | $0.86 |
| Sydney, NSW | $0.85 | $0.81 | $0.83 | $0.90 | $0.87 | $0.82 |
| Perth, WA | $0.98 | $0.98 | $0.96 | $1.05 | $0.99 | $0.87 |
| Average | $0.97 | $0.92 | $0.95 | $0.99 | $0.95 | $0.87 |
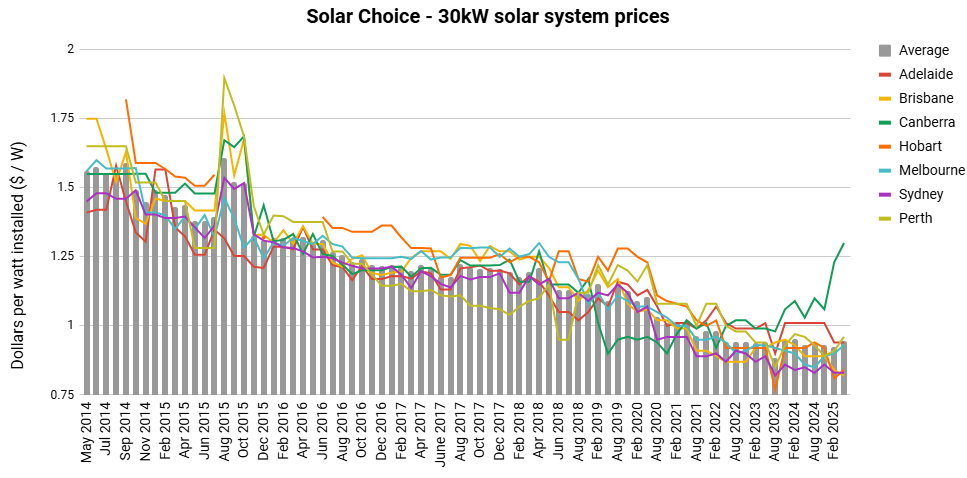
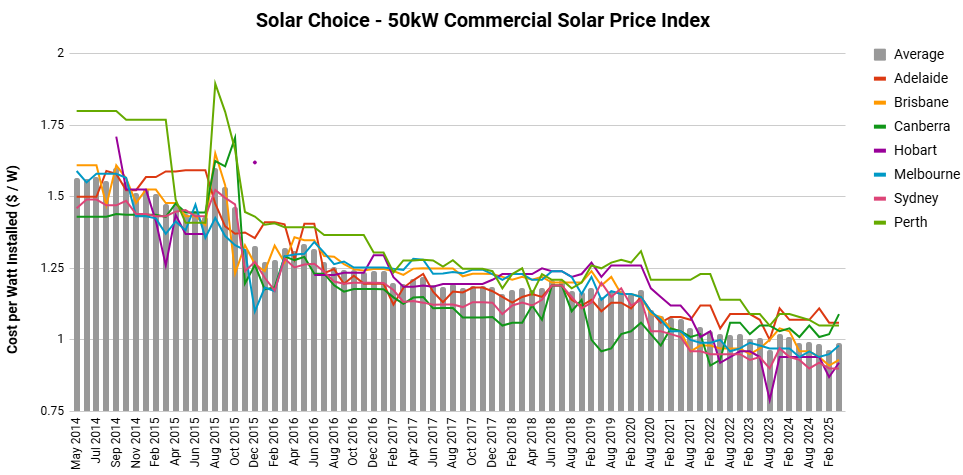
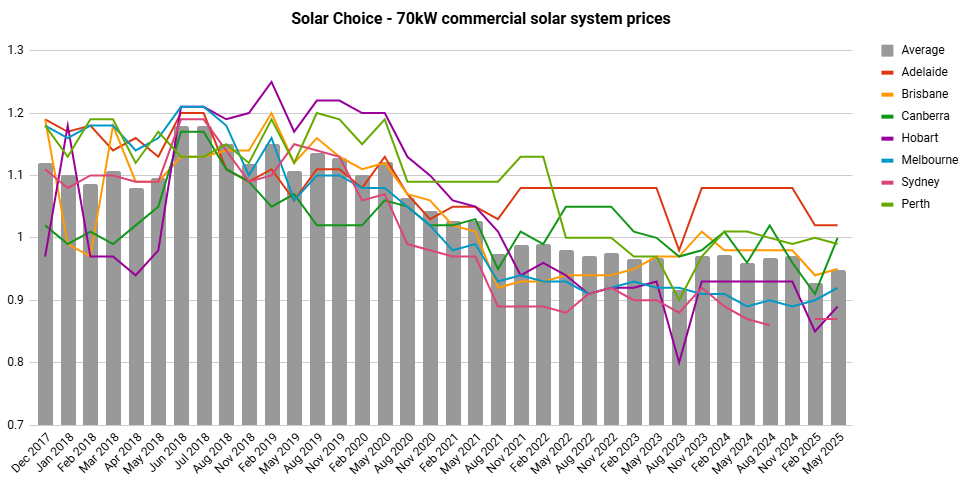
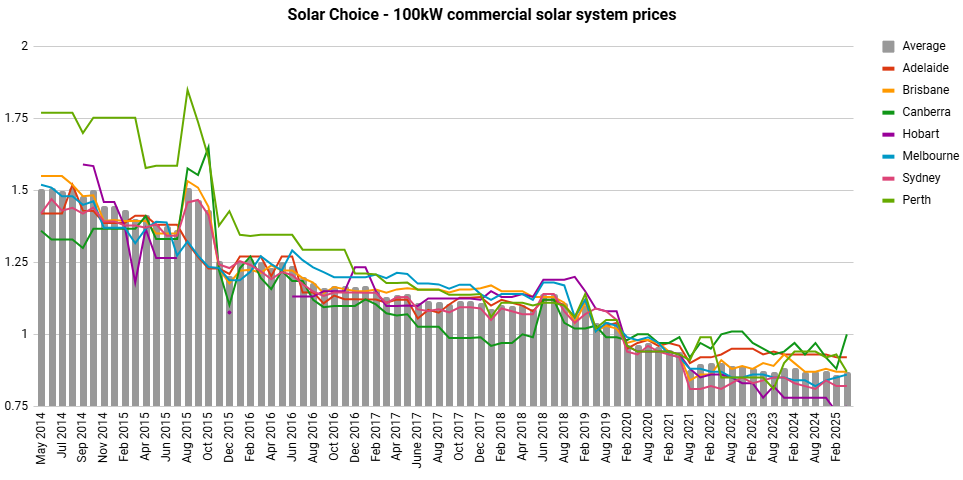
Historic average commercial solar panel prices (August 2012 – May 2025)
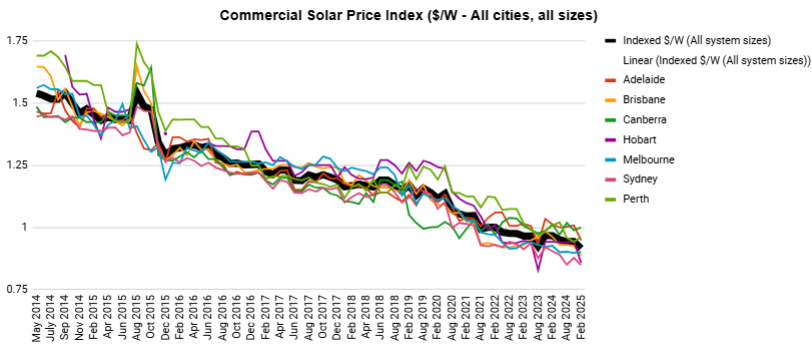
Gallery: Historic commercial solar system prices by system size & city
Request a free solar business case and compare leading commercial installers
Since 2008 Solar Choice has consulted with over 3,000 businesses around Australia and helped develop over 800MW solar commercial and solar farm projects.

CEO at Solar Choice
Jeff has consulted on over 20MW of commercial solar projects, ranging from SMEs to ASX top 100 companies. Jeff has also provided independent advice to 100s of residential solar, battery and EV charging customers across every state in Australia. He holds an MBA from the Australian Graduate School of Management and is an expert in business strategy and financial analysis.
Latest posts by Jeff Sykes (see all)
- Why a big battery could be cheaper than a small battery with the federal rebate? - 19 June, 2025
- Heat Pump Costs – Solar Choice Price Index - 1 June, 2025
- Solar Panel Costs: Solar Choice Price Index | July 2025 - 1 June, 2025
I’m looking to price for a three camp grounds to be completely self sustaining with the greatest window of power storage (Eg; for overcast or rainy weeks). As automated as possible. Minimal maintenance with maximum input (free quote?).