[This article was originally published in May 2018]
I’ve had Solar Analytics installed on my home now for about 3 months. Since that time I’ve referred to and shared screenshots of their app & web portal on numerous occasions – but it’s about time I wrote a proper review!
How did I get Solar Analytics?
I should note that Solar Analytics provided & installed their device for me for the purpose of a review – at no cost to me. The Solar Analytics unit is installed alongside two other third-party monitoring systems (namely, carbonTRACK and Reposit First) at my science experiment of a house in Newcastle NSW, where I’ve got 4.4kW of solar on my roof. My aim is to compare & contrast these different monitoring platforms to help would-be owners decide on which one is best for them.
Although I had Solar Analytics installed as a retrofit to my existing system, more often than not their units are being installed alongside brand new solar (and battery) systems as a bonus feature or as an alternative to inverter-based monitoring (which is generally more simplistic and one-dimensional).
Compare quotes from up to 7 installers in your area now.
About Solar Analytics as a company
Origins in academia & focus on – you guessed it – analytics
Solar Analytics is Australia’s most popular energy monitoring system, with over 18,000 units installed nation-wide as of mid-2018. The company has its origins in academia, with Australian Photovoltaic Institute (APVI) head Dr Renate Egan being one of the founding members back in 2012.

Solar Analytics founders Stefan Jarnason, Valantis Vais, Dr Renate Egan and Dr John Laird.
As such, the bent of Solar Analytics’ software – as the name might imply – is analysing & evaluating solar production data. This means that it is some of the most agile technology available for solar system monitoring, providing users with detailed insights into their system’s performance in light of the components uses, shading impacts and the local weather.
 Certified B Corporation
B Corps are for-profit companies that balance social & environmental goals against making a profit. Although it’s unlikely that a company selling solar monitoring software is going to turn out to be an unscrupulous, ruthless capitalist monster bent on taking over the world, that fact is that you never know what a taste of power might do to a person (or company). If this is something that keeps you up at night, you can rest easy knowing that Solar Analytics have signed the B Corp Declaration of Independence, which means they have an ongoing “commitment to being a purpose-driven organisation that creates benefits for all stakeholders, not just shareholders.”
Based in Redfern, Sydney
In addition to being wholly Australian-owned, Solar Analytics is also Australian-operated and Australia-based, with an office with about 40 employees around the corner from Redfern station in Sydney’s Inner West. Calls and emails to their help centre are answered locally as well.
What does their hardware look like & how does it sit in the meter box?
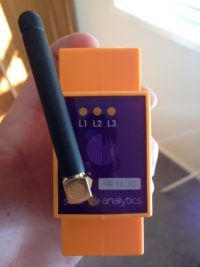
Solar Analytics units are compact, antenna-equipped boxes that (in most instances – including mine) sit inside your meter box alongside your circuit breakers. They are the smallest of the three switchboard-integrated energy monitoring systems that I’ve had installed at my home (not that having available space matters particularly much for a wall that I hardly ever look at).
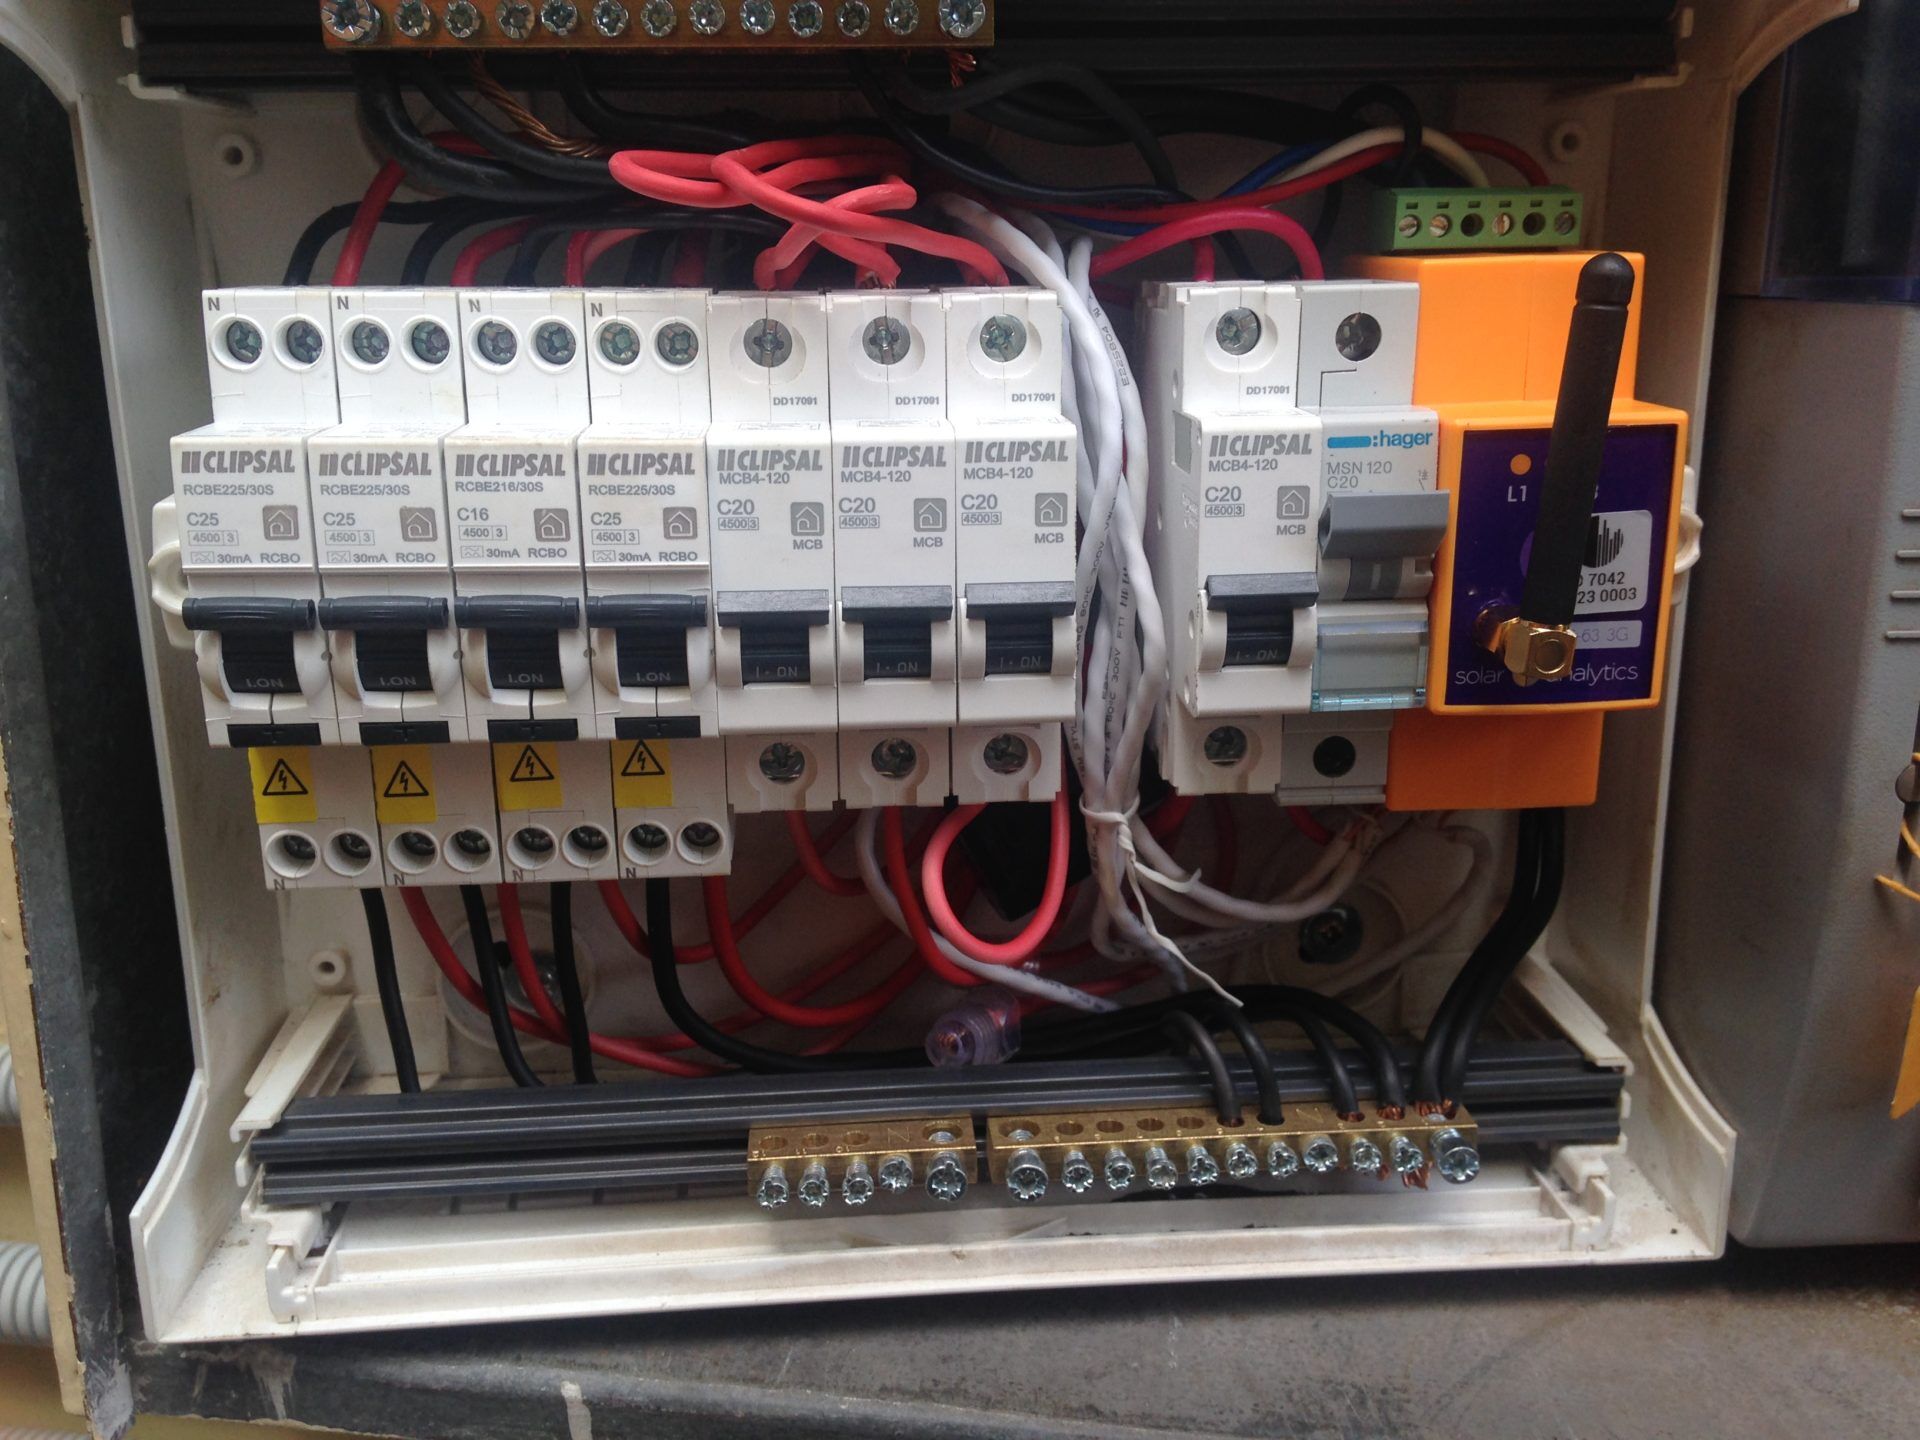
Solar Analytics’ hardware (orange box) in my meter box. Note that this photo was taken with the cover off – it looks a bit nicer with it on.
Solar Analytics is connected to my electricity mains & solar inverters via a series of CT clamps that live in the cavity behind the meter box. In my case, a 3-phase unit was required because I’ve got a 3-phase connection, but most households will only need a single-phase device. To further complicate things, my home has 2x separate solar PV systems, which means 2x inverters that require separate monitoring. This left me with one spare CT clamp, which I had hooked up to my off-peak/controlled-load hot water as a bonus (this feature may not be available for all Solar Analytics installations).
 How does it connect?
Solar Analytics sends out the data it collects via a 3G mobile connection, which means that it isn’t prone to the outages of a WiFi connection. Unlike WiFi, having data sent over 3G means that you don’t need to worry about potentially having to move or hard-wire your WiFi router to make sure it’s connecting with your monitoring unit if the signal is weak. Nor will you have to reconfigure your connection if your WiFi goes down (e.g. due to a power or internet outage or new router).
While 3G is a more reliable connection, you also have to pay for it – albeit not much. At the time of writing, monthly Solar Analytics subscription fees start at $2.50/month – with a discount applicable if you pay for the year in advance.
What’s it capable of?
Solar Analytics see their technology as not just a simple monitoring solution, but as a way to ‘maximise your solar earning potential’, according to their website. It does this by a) allowing users to check (or be otherwise informed) whether their system is performing as expected, and b) allowing them to understand their own energy consumption patterns and contrast this against he solar energy they produce.
Solar Analytics pride themselves on having some of the most sophisticated solar & home energy monitoring software available in Australia. From the beginning, and in accordance with their origins, their focus has been on accurate solar monitoring. Solar Analytics will tell you not only how much solar energy your system is producing right now (and has produced historically), but also how those numbers square up against what their solar-smart algorithm would reasonably expect of your system (see ‘Performance’ below).
Their platform also allows users to monitor household energy consumption alongside solar energy production and estimate your energy costs on a day-to-day basis – giving you actionable insights about your energy use, and helping you to avoid bill shock by knowing what to expect from your next energy bill.
The many faces of Solar Analytics monitoring
Like most monitoring platforms I’ve used so far, Solar Analytics presents itself slightly differently in the app view and browser (web portal) view, although both contain most of the same pieces of information and general arrangement (with the mobile version being understandably more condensed).
I’ve broken down the different monitoring aspects available on the Solar Analytics menu below.
Current state / Live Monitor: What’s happening right now?
Solar Analytics’ ‘Live Monitor’ sits at the top of the home screen and lets you know how many kilowatts of energy your system has produced in the last 30 seconds – which isn’t quite real-time but is close enough for most people. Clicking or tapping the Live Monitor button will bring up a view of energy produced & consumed in the last hour. This is handy if you want to have a closer look at how much energy specific devices use, or if you need to do some troubleshooting for your solar system.
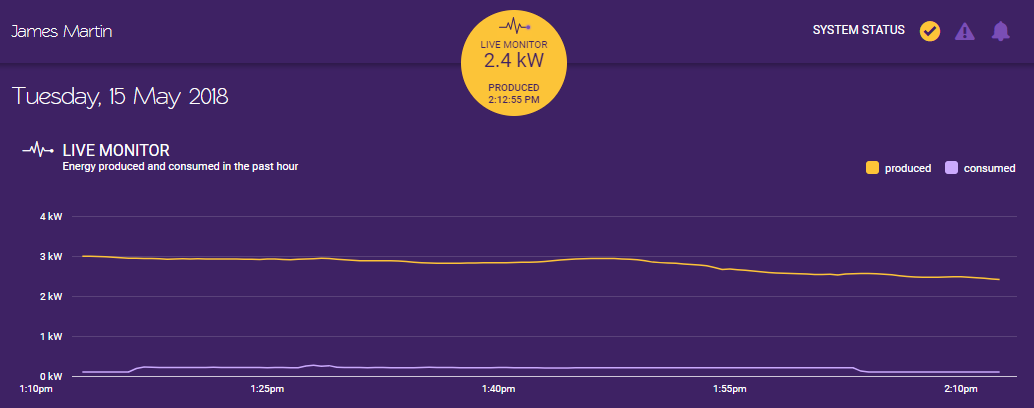
Solar Analytics’ ‘Live Monitor’ gives users an idea of how much energy they’ve been producing and consuming over the last hour, with current usage/production highlighted in the bubble above.
Today: An overview of the day’s activity
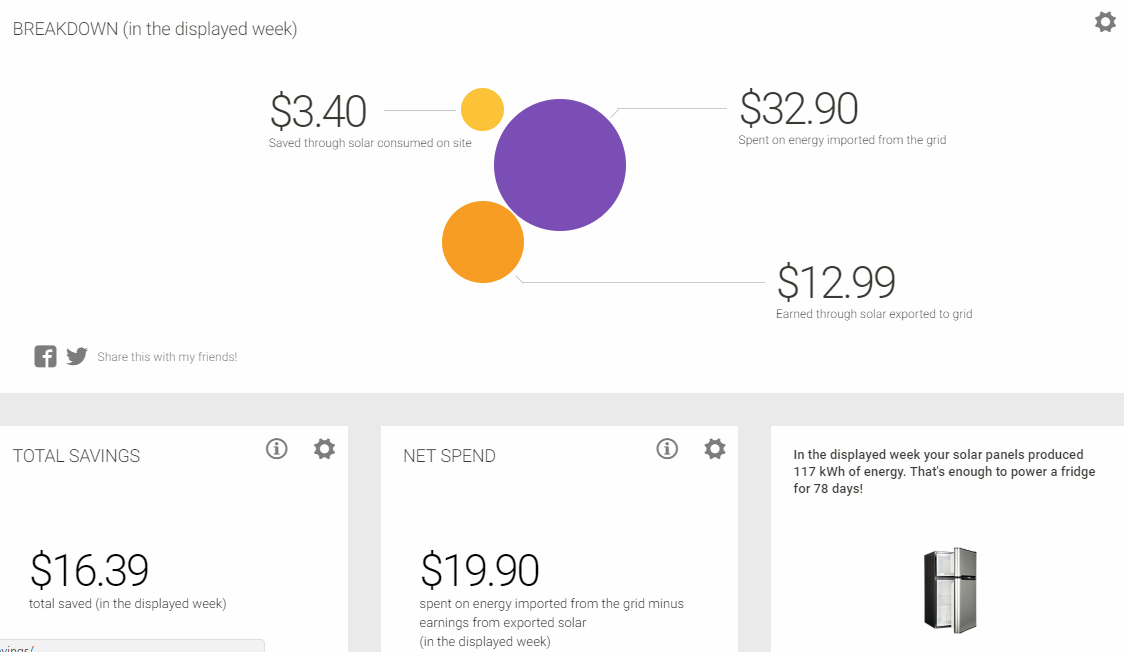
This screen displays the most important general info you might want to know about your system on a given day. Firstly, you can see what your solar production curve looks like so far for the day, followed by a bubble chart showing solar self-consumption (energy offset), grid energy import (purchased from your retailer) and solar export (for feed-in tariff credits). It gives you a happy tick mark if your system is performing as expected – or some less-than-happy marks if it’s detected an issue (see ‘Performance’ section below).
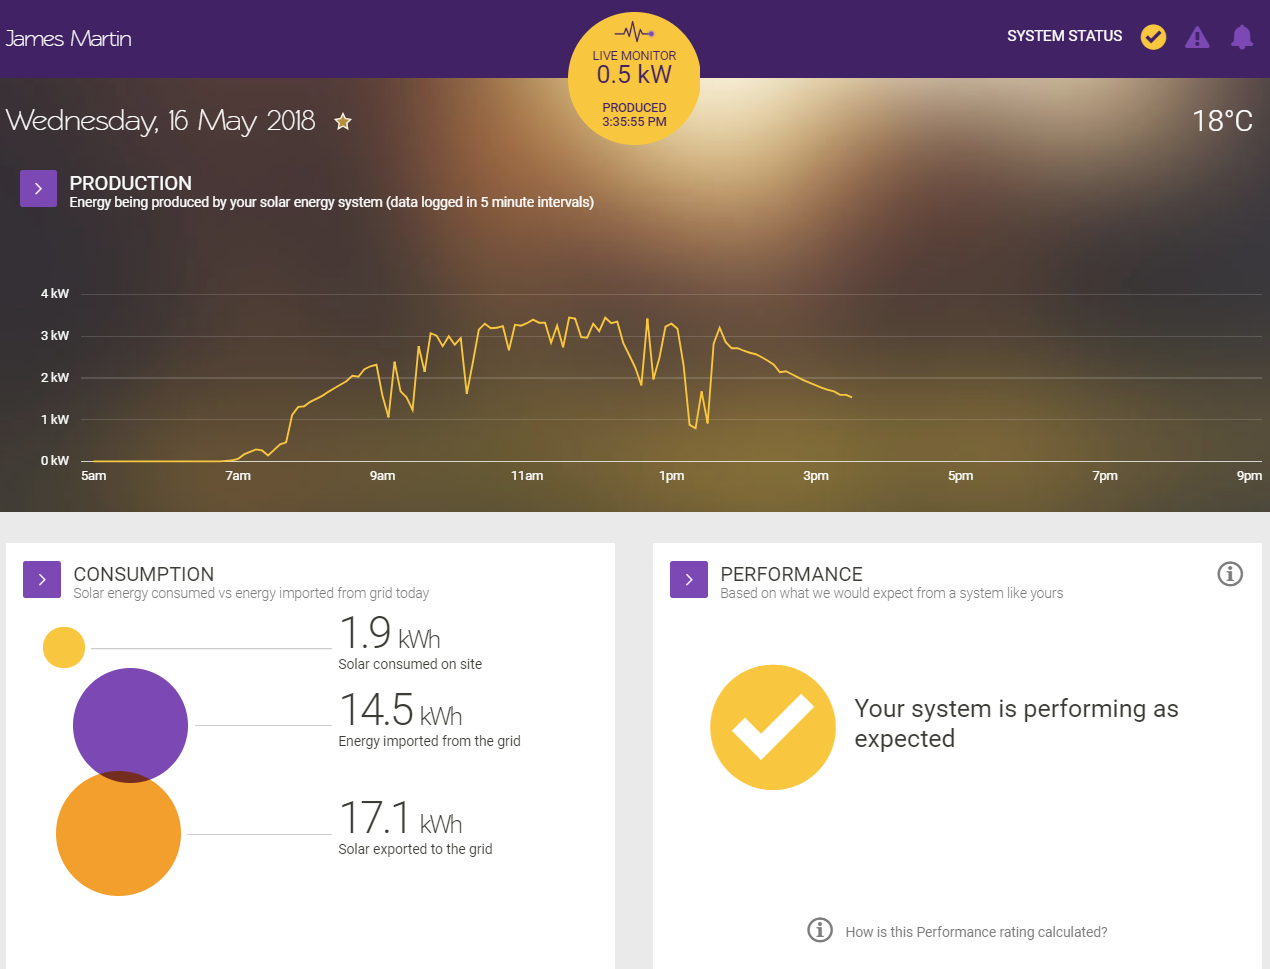
Production: How much solar is your system producing?
What sets Solar Analytics clearly apart from other monitoring platforms is its ability to tell you not just how much energy your solar system has produced, but to tell you how that number fits into the specific context of your solar system in your location, among other factors. None of the other monitoring systems I have installed even attempt to undertake this sort of sophisticated number crunching.
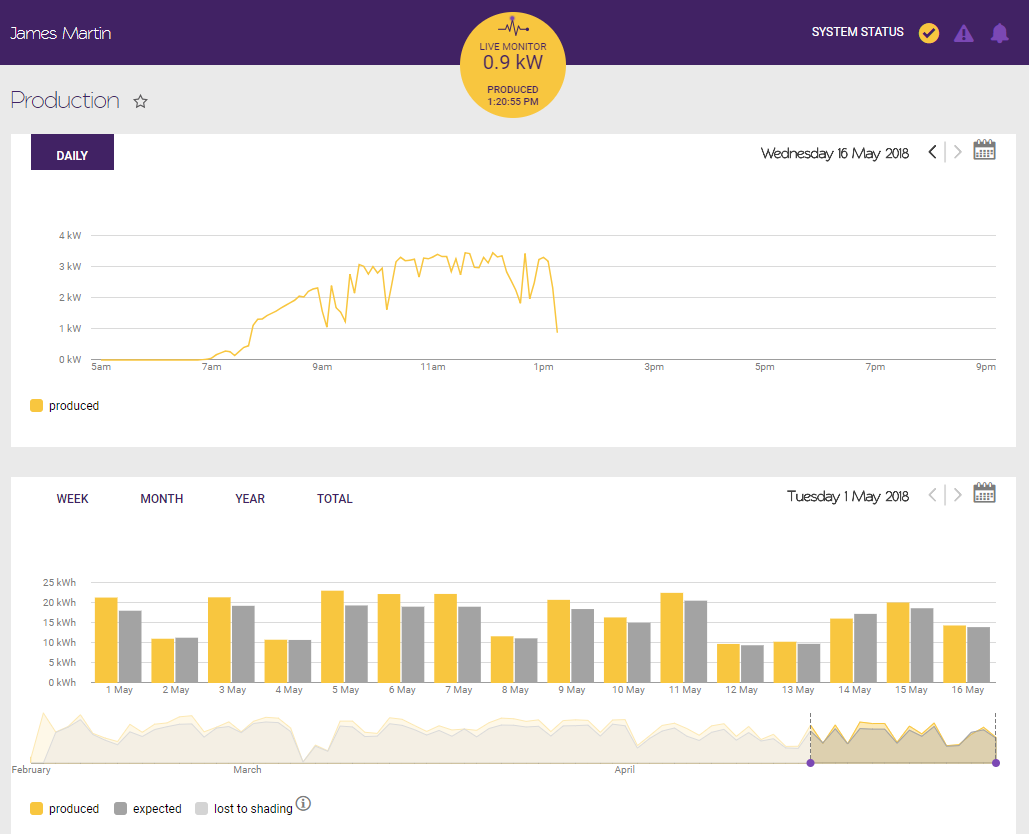
There are two main things that Solar Analytics will tell you when you go to the ‘production’ view in their dashboard:
- A graph of your solar system’s energy production for the day; and
- Historic data on your solar system’s energy production (vs ‘expected’ figures).
The first one is pretty self-explanatory, while the second is a bit more interesting – so that’s what I’ll focus on. Basically, Solar Analytics’ algorithms work to determine how much energy your system should be producing in light of the specifications you’ve plugged into it, and displays that expected figure as a bar in a graph next to the actual production. If your system is calibrated correctly and there are not problems with its operation (e.g. unexpected shading or a malfunction), the ‘produced’ and ‘expected’ bars should look more or less the same. (In my case, my system seems to be meeting or exceeding expectations on a daily basis.)
The graphs will apparently also tell you if you’ve lost any solar production to shading. However, while both my solar arrays are north-facing and are without any kind of shading most of the day, I have been noticing that from late autumn, in the early morning (just as the panels are firing up, around 7:00-7:30am) a tree from the neighbour’s yard casts a shadow on one of the arrays – and Solar Analytics isn’t (yet) picking up on this. Granted, the shading is relatively minor and occurs during a time of day when the panels wouldn’t be producing much anyhow, and so was perhaps small enough to fly under Solar Analytics’ margin of error. I’m interested to see if they pick up on it as we approach the shortest day of the year next month.
(N.B. See more on this topic in the ‘Performance’ section below.)
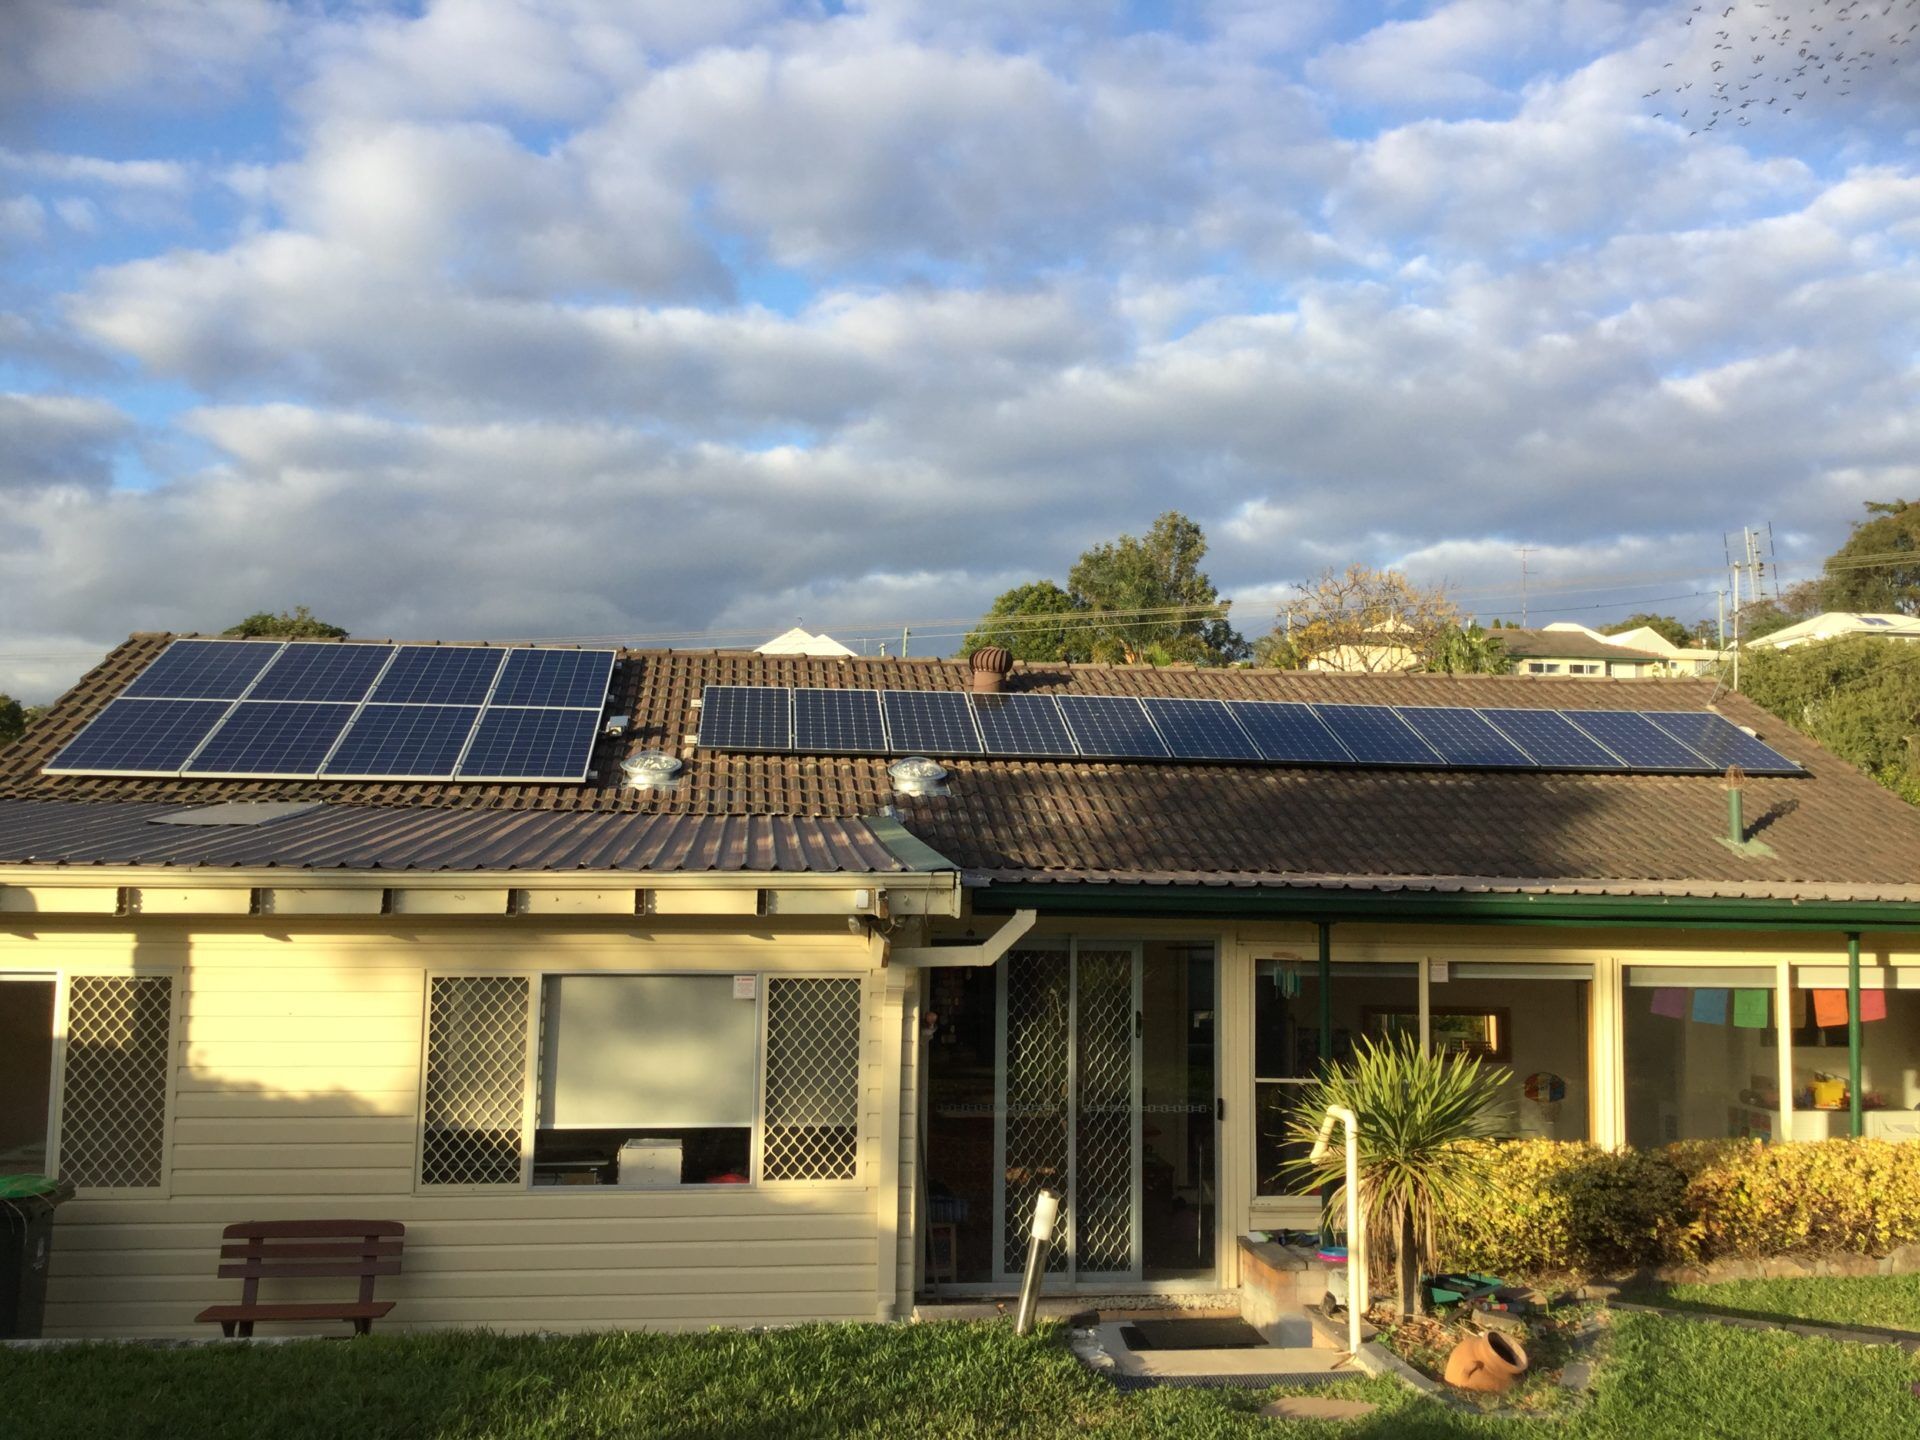
Early morning shading on my older system on the western side of my north-facing roof. The shade is cast by a tree in my neighbour’s yard at about 7:00-7:30am in late autumn & winter.
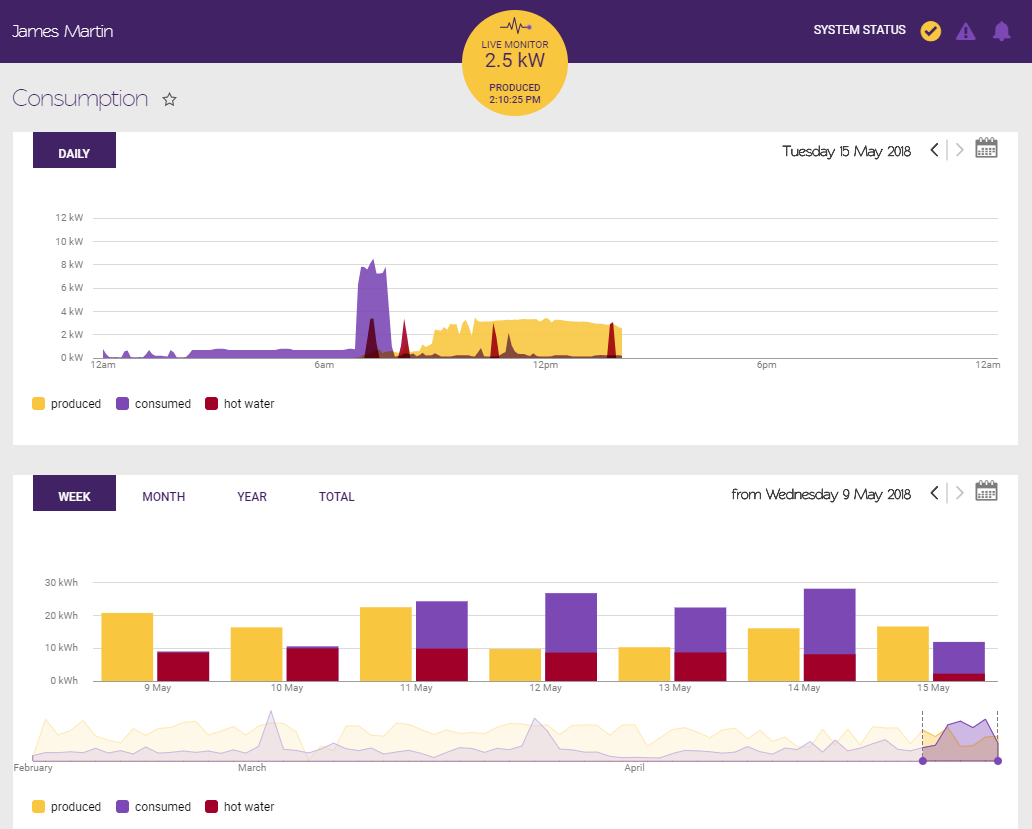
Consumption: How much energy you’re using vs solar energy production
The screen that I have saved as my default dashboard in Solar Analytics is the consumption screen (which is customisable); it shows me both my energy usage as well as my solar energy production. Like other interfaces in the dashboard, you can toggle the buttons at the bottom of the graphs (production, consumption, hot water in my case) to see them on their own, without layering. You can also click the arrows at the top right of each panel to zoom through data for different time periods (day, week, month, year).
Solar Analytics consumption (and production) overview in the desktop portal.
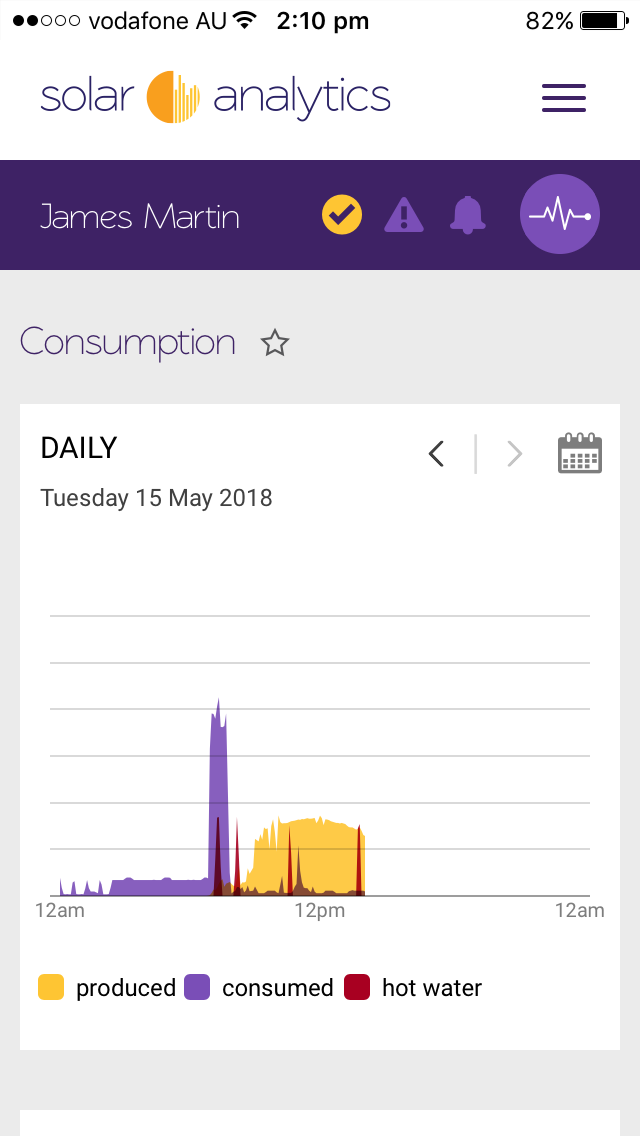
And the same view on a mobile device (iPhone app, in my case).
Performance: Overall solar system health in detail
This screen is arguably what sets Solar Analytics apart from its competitors most. Here, you can check if your solar system is operating as expected given the age of the system, its individual components, tilt, orientation and the local weather.
Other monitoring platforms will send you warnings if there’s a major fault (like a dangerous earth fault, which even inverters are mandated to report now) or a complete failure of your system, but Solar Analytics’ boast is that it can pick up on much more subtle deviations that would fail to set off alarm bells in other platforms. Some examples:
- Over the years, a tree has grown taller and is shading out an ever-growing section of your solar panel array, causing the output to drop in a way that would be hard to pick up on unless you were paying close attention. Solar Analytics promises to let you know – through notifications – as soon as this impact becomes significant (although, to be honest, I’m not sure how they define ‘significant’ here).
- One of your panels is suffering from premature degradation due to delamination; the impact is initially small but will increase gradually. Solar Analytics can help you nip the problem in the bud with a pre-emptive notifcation alerting you that something could be amiss.
In fact, during my less than 3 months of months of usership, I have already witnessed how Solar Analytics’ algorithms work their magic. First, I was consistently receiving warnings that my system was producing more energy than expected. While this seems like a weird thing to be warned about (who would complain about too much solar energy?), Solar Analytics’ info button was quick to inform me that this could indicate a calibration error – that the details of my system hadn’t been entered correctly.
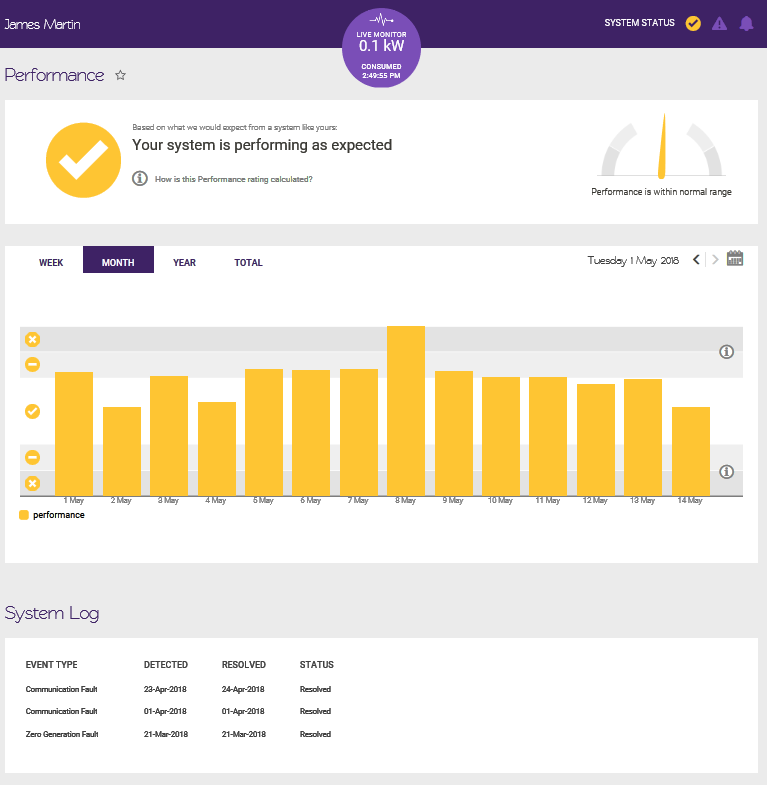
System overperformance displayed on the performance page. While my system was functioning normally some days, it was producing much more energy than expected on others.
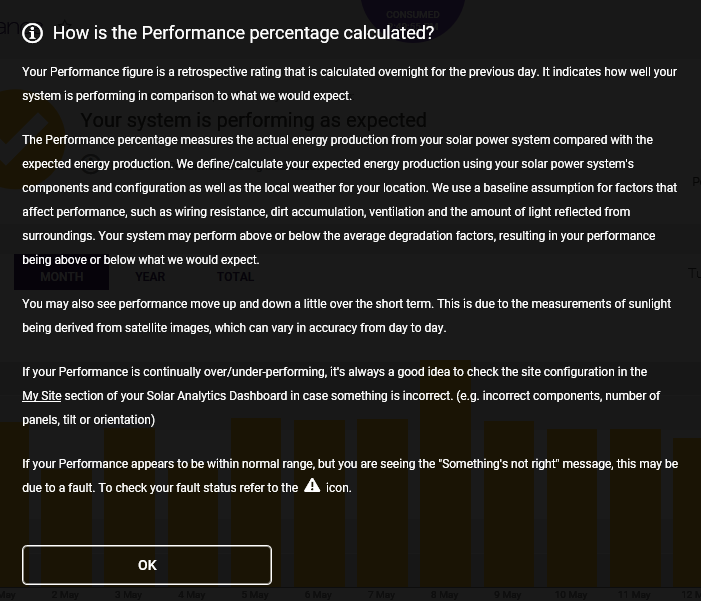
Solar Analytics told me in this handy pop-up that the issue could be due to the wrong data having been entered for my site.
Solar Analytics continued to be perturbed by my system’s strange activity, notifying me of it on a regular basis (basically every time I logged in). I finally started paying a lot more attention to it while writing this article, and realised that it had my roof tilt listed as 20 degrees from the time I had it set up. I stepped out side and made some unscientific triangle gestures with my hands and determined that the angle was closer to 30 degrees – and updated my ‘site’ data accordingly.
After I made that change but saw no difference in my data, I decided to call up the Analytics team on their 1300 support number (which I found via the ‘support’ section of their portal). They rang me back the next morning (I had called them at 5pm) and let me know that they hadn’t yet got around to officially implementing that data – which they did then and there. When I refreshed the page, my the overperformance warnings had disappeared! This gives me faith that the performance data that I see via Solar Analytics will continue to be trustworthy going forward.
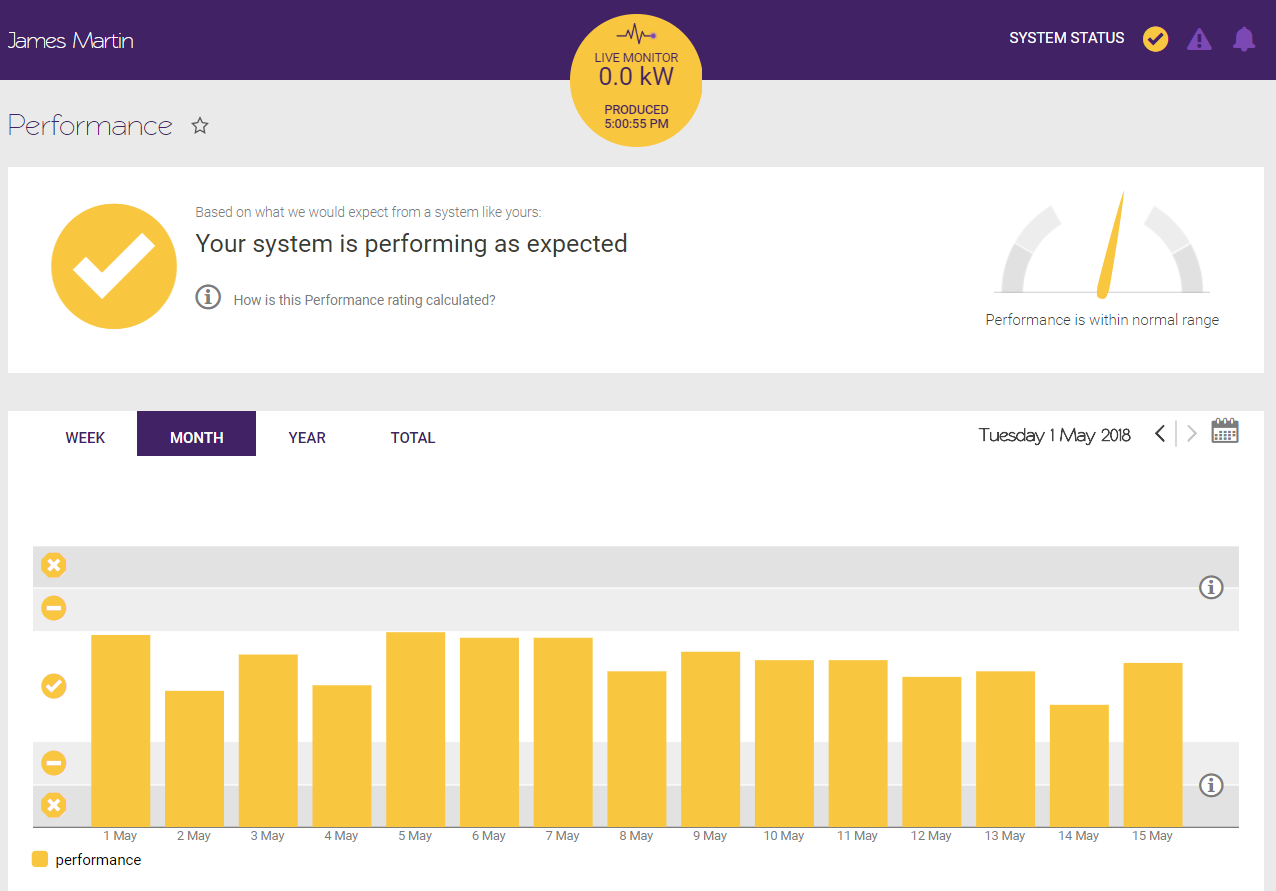
My system’s performance after adjusting the tilt angle in the ‘site’ settings – looks like it was a calibration error, as Solar Analytics suspected.
Battery: Size estimation and performance
If (like me) you don’t have battery storage for your home, Solar Analytics can make an informed size recommendation for you. After collecing 30 days’ worth of your energy production and consumption data, a button will appear in the ‘battery’ section of the platform; when you press it, Solar Analytics will advise on the best potential system size for your needs (based on best returns). In my case, the recommended size is 4kWh – which is roughly in the ballpark of what I would have decided on for myself (as it’s better to get a smaller battery bank than a larger one).
And I’ve been told (but haven’t yet seen, since I don’t have a battery to monitor) that Solar Analytics will also track the flow of energy into and out of batteries once they’re installed – but that its ability t keep track of the amount of stored energy (the battery’s ‘state of charge’) is a bit more limited. This means that while Solar Analytics can tell you how your battery is helping you to save money and be independent of the grid, you may have to refer to a separate battery app (if you’ve got one) to see how much energy you have on reserve.
(I also note that this ‘state of charge invisibility’ problem isn’t unique to Solar Analytics – even with other monitoring systems, the ability to see this info may come down to the manufacturer of the battery in question.)
Solar savings
Solar Analytics also takes your electricity tariff data and uses it to show you estimates of how much money your solar is saving you – both from solar self-consumption & with solar feed-in credits.
(As a bonus, you’ll also get fun facts like the one about the fridge below as you go through various screens within the portal – but if you don’t like them, you can switch that feature off.)
A screenshot from the ‘savings’ tab in the Solar Analytics portal.
How much does it cost?
The amount that you’ll pay for Solar Analytics will depend on your situation (e.g. if you’re on a three phase or single phase connection) and the difficulty of getting the hardware into your meter box. Some rough out-of-pocket costs for the most common situations are outlined in the table below.
Also keep in mind that there are ongoing subscription costs for the data collection and delivery. The basic plan is $6/mo or $60 per year.
| Solar Analytics Estimated out-of-pocket costs, incl installation | Single-phase | Three-phase |
| Installed alongside new solar system | $350-$450 | $450-$550 |
| Retrofit onto existing solar system | $450-$650 | $550-$750 |
Warranty
Solar Analytics’ hardware comes with a full 5-year warranty for defects, serviced locally. Basically, if your device stops working, they’ll send you a working one for free and cover the cost of having it replaced.
What about energy management?
One thing that Solar Analytics cannot yet do is ‘reach in’ to your home and switch devices or circuits on or off remotely or on timers. The company is apparently working on an energy management solution, but people with the current hardware will not be able to tap into this new functionality unless they upgrade.
In short
Solar Analytics is a great monitoring platform with a sharp focus on solar performance. It gives you, the user, a huge amount of data about your home’s electricity ecosystem, accessible from the palm of your hand. The company behind it is Australian, and nearly 20,000 units are already installed around the country. At roughly $300-$600 to have Solar Analytics put in at your home, it’s not exactly cheap, but is a worthwhile sum to pay for the insight that it brings – especially if you’re investing in a brand new solar system and want to make sure you’ve got a solid way to monitor its performance.
You can learn more about Solar Analytics at www.solaranalytics.com.
Good article.
I am looking for such a system as Solar Analytics but disappointed that there is no upload to PVOutput.
I currently check my arrays on a daily basis vis a Cat 5 cable from my solar inverter direct to the modem.
This gives me PVOutput 5 minute live updates but more importantly allows me to directly compare outputs with others in the same postcode – or elsewhere- which would reveal performance problems.
I am currently considering SMAPPEE and SOLAR ANALYTICS but have 3 questions:
1. SMAPPEE measures actual voltage which ensures accuracy that other providers cannot achieve – how does Solar Analytics determine voltage?
2. How do Solar Analytics figures compare with PVOutput figures?
I have been quoted $889 for a 3 phase installation which includes the first year subscription.
3. SMAPPEE uses an overseas internet server to hold info and issue updates etc over which the end user has no input control whatsoever.
This is a serious concern re security.
How does Solar Analytics handle information and updates?
Hi HWKA Nigel from Solar Analytics!
We have looked closely at PV Output and while it has some great features there are also some challenges (security and polling frequency) which have kept us away thus far.
Secondly, we also have an interactive and fully automated “local peer comparison/ranking” function. Critically, we are also unique in using satellite and BOM data to produce and report on real performance relative to actual radiation at your site – so we do all that work for you.
In response to your questions:
1) Yes we measure real voltage too (the unit is hard wired) – 1 phase, 2 phase or 3 phase. We are Class equivalent at +/-0.5% accuracy – smappee don’t quote accuracy their brochure that i can see.
2)We offer vastly more data, information and analytics than PV Output. The price you mention coudl be about right (installed by an electrician) but is towards the high end. Bear in mind we can measure a lot more circuits and use 3G for superior reliability.
3) SA uses local servers via Amazon and have passed a number of security audits by Utilities who use our equipment. We are Australian based and owned with 40 staff.
Happy to talk further if you prefer – 1300 651 137
Very interesting reading. I have an Enphase system with which I am not all that thrilled about. It beeps loudly every five minutes or so until yesterday. I could not located the beep, until the Enphase went off-line.
I am thinking of dropping this system despite the useful information it provides but the beeping is driving me round the bend. The parent or servicing company does not do a good job in follow-up service, they do not reply to phone messages, they only email, mostly with inane comments.
So, how do I contact Solar Analytics?
Graham Proctor
Hi Graham,
Sorry to hear about your troubles with the Enphase system. Have you tried getting in touch with Enphase directly to get it sorted?
As for contacting Solar Analytics, there’s a link to their website at the bottom of the article.
Thanks James
Appreciated reading that – especially following on from my thoughts posted 6 months ago or so:
http://www.wattclarity.com.au/2017/11/some-initial-musings-about-my-own-rooftop-solar-learning-exercise/
(note that I paid for my system, but might take your lead and check out others as well)
Paul