The August 2013 Solar PV Price Index marks 1 year since Solar Choice began publishing solar system installation prices in August 2012. While it is clear that figures have come down markedly for 4kW and 5kW systems since that time, cost reductions for the smaller system sizes–although present–have not been as distinct.
This month’s figures for were derived from a larger data set than usual for Sydney, Brisbane, Adelaide, and Perth. Conversely, the number of installers included in the Hobart calculations shrank slightly, yielding numbers that would at first glance appear to reveal huge installation price reductions there.
Average installation costs by city & system size
The table below contains the average solar system installation prices for all capital cities besides Darwin. Although Sydney and Perth are still home to the least expensive systems on offer (see $/W table in the following section), this month Hobart boasts the lowest average system prices when it comes to larger solar systems (3kW, 4kW, 5kW).
It is important to note, however, that only 2 installers were included in the Hobart calculations, with the remaining installer–offering a zero-down solar leasing deal–excluded. Meanwhile, the highest average system prices can now be found in Melbourne and Brisbane.
| Solar Choice: Average Solar PV System Prices* – August 2013 | |||||
| 1.5kW | 2kW | 3kW | 4kW | 5kW | |
| Adelaide, SA | $3,933 | $4,801 | $5,819 | $7,451 | $8,451 |
| Brisbane, QLD | $3,861 | $4,756 | $6,178 | $7,730 | $8,920 |
| Canberra, ACT | $3,081 | $3,848 | $5,481 | $7,603 | $8,636 |
| Hobart, TAS | $3,239 | $4,089 | $5,139 | $6,989 | $7,839 |
| Melbourne, VIC | $3,855 | $4,606 | $6,101 | $7,720 | $8,997 |
| Sydney, NSW | $3,018 | $3,922 | $5,400 | $7,143 | $8,238 |
| Perth, WA | $3,168 | $4,035 | $5,191 | $7,034 | $8,106 |
| All | $3,450 | $4,294 | $5,616 | $7,381 | $8,455 |
$/W solar system prices for August 2013
The following table shows STC-inclusive installation prices for 1.5kW, 2kW, 3kW, 4kW and 5kW solar systems. Where explicitly detailed in installer data, STCs accounted for a discount of about 66c per watt for the Zone 3 cities (Sydney, Perth, Adelaide, and Brisbane), and about 55c/W for Zone 4. No STC numbers were available in the data from Hobart or Canberra installers this month.
| Solar Choice: PV system prices, $/Watt – August 2013 | ||||||
| 1.5kW | 2kW | 3kW | 4kW | 5kW | ||
| Adelaide, SA | Average | $2.54 | $2.38 | $1.96 | $1.90 | $1.68 |
| High | $3.72 | $3.03 | $2.41 | $2.14 | $2.08 | |
| Low | $1.70 | $1.99 | $1.66 | $1.70 | $1.54 | |
| Brisbane, QLD | Average | $2.50 | $2.35 | $2.07 | $1.95 | $1.77 |
| High | $3.78 | $3.28 | $2.88 | $2.61 | $2.23 | |
| Low | $1.59 | $1.66 | $1.47 | $1.64 | $1.42 | |
| Canberra, ACT | Average | $1.89 | $1.95 | $1.85 | $1.93 | $1.71 |
| High | $2.18 | $2.14 | $1.99 | $2.08 | $1.95 | |
| Low | $1.70 | $1.71 | $1.66 | $1.70 | $1.54 | |
| Hobart, TAS | Average | $2.02 | $2.04 | $1.71 | $1.75 | $1.57 |
| High | $2.18 | $2.10 | $1.77 | $1.80 | $1.60 | |
| Low | $1.70 | $1.99 | $1.66 | $1.70 | $1.54 | |
| Melbourne, VIC | Average | $2.47 | $2.28 | $2.06 | $1.95 | $1.80 |
| High | $4.17 | $3.47 | $3.13 | $2.53 | $2.53 | |
| Low | $1.70 | $1.95 | $1.66 | $1.57 | $1.57 | |
| Sydney, NSW | Average | $1.95 | $1.96 | $1.80 | $1.79 | $1.66 |
| High | $2.97 | $2.72 | $2.26 | $2.01 | $1.95 | |
| Low | $1.32 | $1.65 | $1.47 | $1.58 | $1.41 | |
| Perth, WA | Average | $2.02 | $2.00 | $1.75 | $1.74 | $1.60 |
| High | $2.34 | $2.15 | $2.06 | $2.04 | $2.93 | |
| Low | $1.70 | $1.85 | $1.60 | $1.47 | $1.40 | |
| All | Average | $2.20 | $2.14 | $1.89 | $1.85 | $1.69 |
| High | $4.17 | $3.47 | $3.13 | $2.61 | $2.53 | |
| Low | $1.32 | $1.65 | $1.47 | $1.47 | $1.40 | |
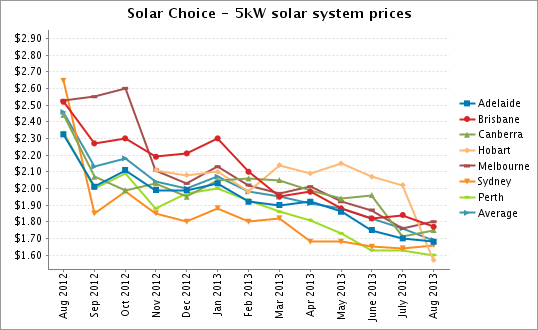
Solar PV system prices to date
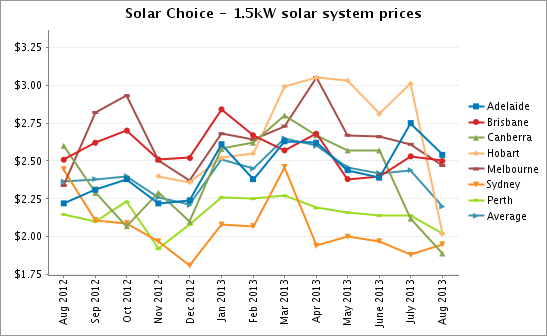
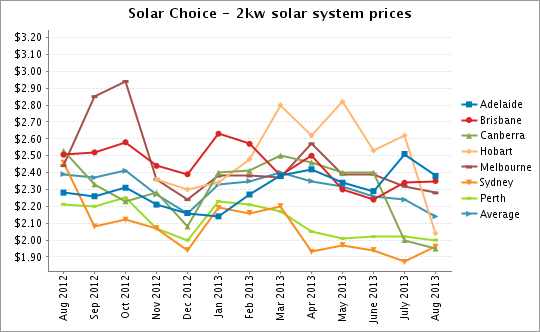
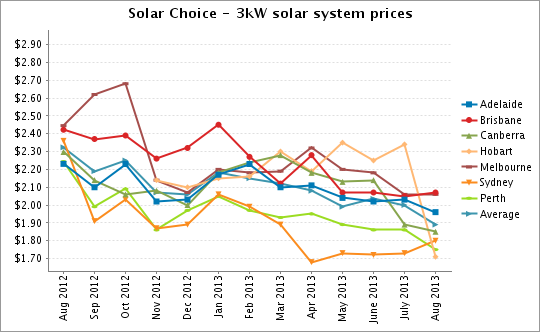
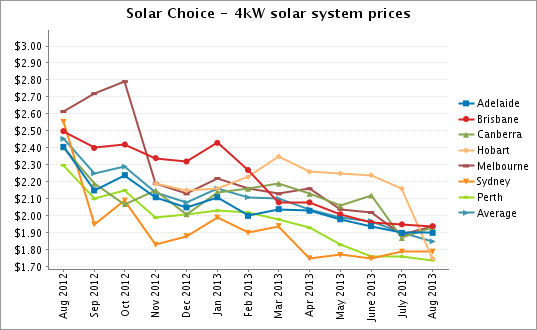
Average system prices continued to fall in the ACT (albeit more gradually) following the sharp drop that was observable between June and July. Prices in most other cities have similarly fallen in varying degrees, except for Sydney and (to a lesser degree) Brisbane, where slight rises were observable, possibly due to the inclusion of new installer data in those cities. The biggest change, however, as noted above, was in Hobart, with apparently sharp reductions across all system sizes.
About this data
Tables and charts included in this article were created using data from Solar Choice’s installer network database, which contains regularly-updated pricing and product details from over 125 solar installation companies across Australia. Prices do not incorporate meter installation fees or additional costs for difficult installations. The discount available to Solar Choice customers is also excluded from the calculations, as are prices for ‘premium’ installer offerings.
About Solar Choice
Solar Choice is a solar PV installation and advice service based in Sydney, NSW, providing free Solar Quote Comparisons for residential solar customers Australia-wide. Solar Choice’s commercial wing, Solar Choice Commercial, manages tenders for medium- to large-scale solar projectes for a wide range of clients.
© 2013 Solar Choice Pty Ltd
- Solar Power Wagga Wagga, NSW – Compare outputs, returns and installers - 13 March, 2025
- Monocrystalline vs Polycrystalline Solar Panels: Busting Myths - 11 November, 2024
- Solar Hot Water System: Everything You Need to Know - 27 February, 2024
Thanks a lot for helping with my questions and providing the links. I’ve already recommended you guys to my Australian extended family.
Thanks for recommending us! Glad we could be of assistance. Are you located outside Australia yourself?
In Sydney, Hobart and Canberra the average cost of 2 kW systems is more than 1.5 kW systems? This doesn’t make sense to me. Is this due to a small sample size or is there some other mechanism at work?
Any idea where one can find opensource monthly data on the value of the STCs? I’d just like to have a feel for the unsubsidized cost of solar in Australia. I’m figuring about $30 across the board. Is that reasonable?
Any rumors of cutting back on the STCs in the nearterm? Would that be a post election thing?
Hi Photomofoo,
Thanks for reading. I would attribute that disparity to the small sample size–the trend in all other cases is for $/W costs to decrease as system sizes increase.
Not sure where you can find open source data on STC prices, but the Clean Energy Council has STC and LGC spot prices listed at the top of their homepage, and Green Energy Trading has them here. As written in the article, the average STC discount works out to about 66c/W in zone 3 cities, which can be calculated backwards to about $32/STC for a 5kW system (which gets 103 STCs), so you’re pretty much on the mark with $30. I’d say that prices range from about $28 to $32/STC, though, with some installers offering more, some less (at least for this month).