Those in the market for a solar PV system and carefully considering their options are constantly on the lookout for more information on solar system sizes and components (namely, inverters and solar panels). It is not always easy to get specific, accurate information on how a system might operate once installed in a certain area. PVoutput.org is an extremely useful resource for people who would like to have an idea how much power a system in their area will produce, as well as to check their system performance against that of others located in the same area.
PVoutput.org: Data from system owners like you
PVoutput.org is a site that is free to use, and whose database is composed of solar system output data from system owners throughout Australia. After having their system installed, owners register with PVoutput and upload their data to the site to share.
The site is a commendable, grassroots undertaking, and is arguably a more useful than the Desert Knowledge Australia Solar Centre website, (if not as intuitive and user-friendly) because it is possible to find data from systems of comparable size to their own in locations with similar or identical climatic conditions–The Desert Knowledge Solar Centre is based in Alice Springs, NT, and hence all data are for Alice Springs conditions.
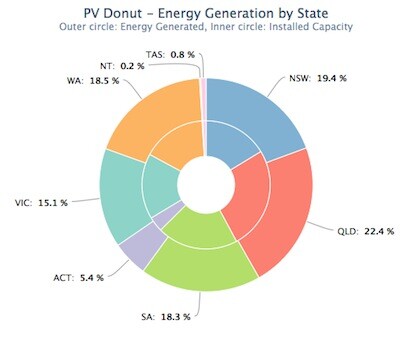
The bulk of the data on PVoutput.org is from Queensland, New South Wales, South Australia, and Western Australia, but there is also a significant number of registered systems from Victoria, as well as a smaller number from the ACT, Tasmania, and the Northern Territory.
How does PVoutput work?
Because the PVoutput website is not a commercial one (it remains operational thanks to donations), and the data is user-generated, using the PVoutput system is not always a walk in the park. Sometimes you will come across systems that have no output data or only patchy output data, or solar panel and inverter brand and model names are not always uniform, occasionally making a search for specific components a bit of a mission. But those who are willing to put in a bit of time to understand the system will have access to one of the most comprehensive, unbiased databases on solar PV system output in Australia.
An example
Let’s assume, as an example, that you are interested in having a solar system installed in Brisbane in the near future. How would you find systems in the area that might give you an indication as to how much solar electricity your solar PV system would produce?
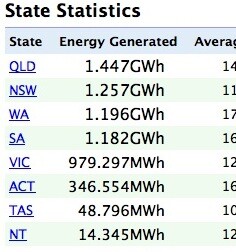
1. Go to the PVoutput.org ‘PV Donut’ page, which lists output by state. Click on ‘QLD’ or the link for your state under ‘state statistics’. (The statistics, by the way, are based only on the PVoutput database, not actual state installation statistics.)
2. You’ll see a map and a list of systems on the Queensland page. You can navigate around in the map. The yellow and blue bubbles indicate a high density of solar PV installations in that area (the number indicates how many). Clicking these twill take you to a higher zoom level, where you can get individual system data.
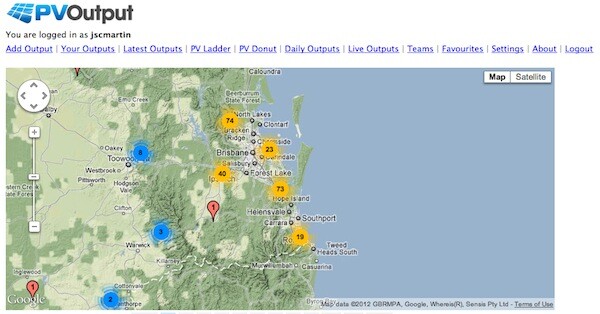
The red bubbles are for systems located very closely together. Clicking on them will bring up data for those systems–if there is more than 1 system, systems will be shown in list format. Click on a system’s capacity (in blue, e.g. 3.040kW) for individual system information.
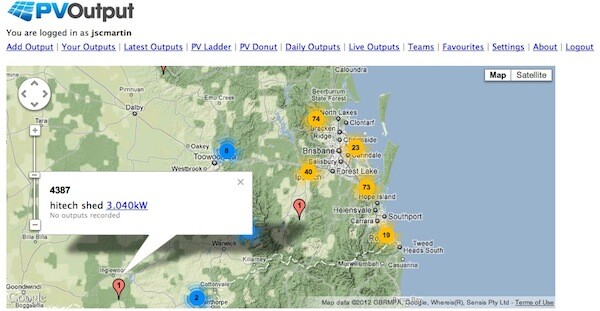
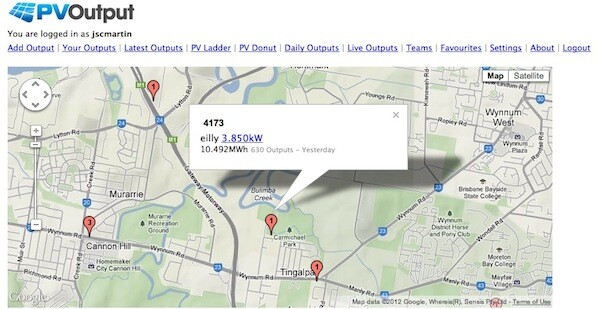
3. Click on bubbles or zoom to specific areas to find systems near your proposed system location. In This case, I have chosen a system in postcode 4173 near Tingalpa. In this view, we can see that the system’s name is ‘eilly’, its capacity is 3.850kW, and it has produced 10.492MWh of electricity to date.
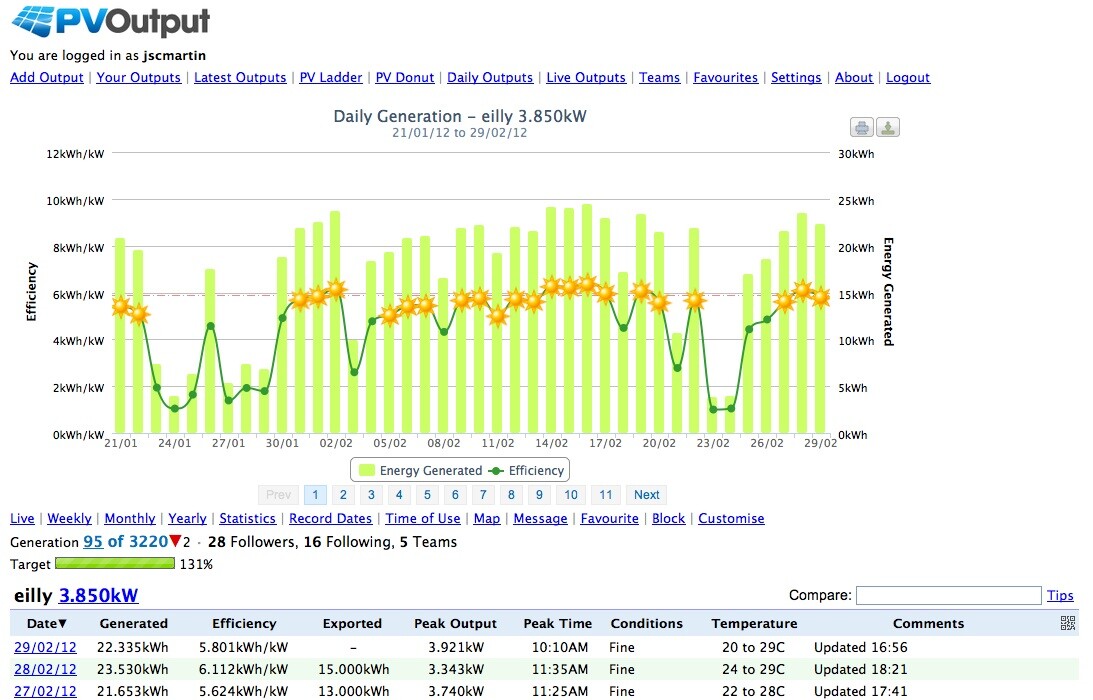
4. Click on the capacity (in blue) to go to the system output page. Here you can see (presuming the system operator has been updating their information) system output data, system efficiency, and weather.
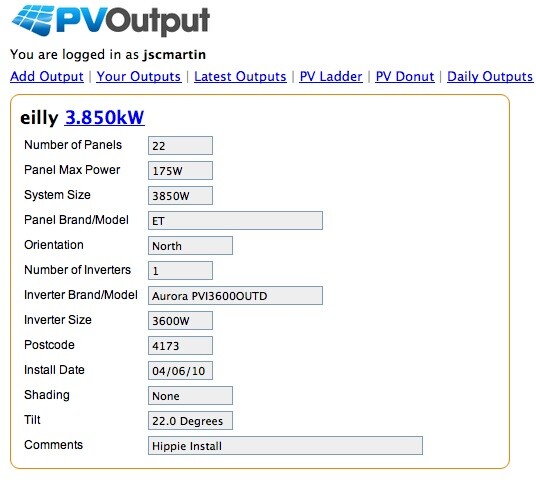
5. Hover over or click the system capacity (bottom left, in blue, next to system name) to get information on the makeup of the system, including the number of panels, individual panel rated maximum output, and panel and inverter brand.
Become a PVoutput contributor
Remember that, once you have had a PV system installed, you can register with PVoutput.org to contribute to and compare your system output details with those of other systems already in the database. The site has a number of different functionalities beyond those detailed above, and is worth some exploring if you have the time.
© 2012 Solar Choice Pty Ltd
(Images via PVoutput.org)
- Solar Power Wagga Wagga, NSW – Compare outputs, returns and installers - 13 March, 2025
- Monocrystalline vs Polycrystalline Solar Panels: Busting Myths - 11 November, 2024
- Solar Hot Water System: Everything You Need to Know - 27 February, 2024
I have had a 4.5 kw system installed ,but have the old style spinning meter .I do not want a smart meter because of health issues .What are my alternatives ?
Hi Russell,
You would be best to approach your electricity utility to learn about the options available to you re: meters. They may have other options if you are not comfortable with a smart meter.
In the meantime, the state of Victoria has published information about the health risks associated with smart meters which you can read about here.