I’ve now had two energy monitoring systems fully functioning for a few weeks, and it’s fascinating to see what my 4.4kWh solar system is capable of. It’s also interesting to learn just how little energy my home uses (about 10-14kWh/day) compared to the 15-25kWh averages I always hear about. (Meanwhile EnergyMadeEasy tells me that the average for a similar home in my post code is about 19kWh/day).
Excluding our electric hot water consumption, on average we’re only using about 5-7 kilowatt-hours per day. The hot water is on controlled load so we’ve got no say over when the element switches on and off (for now), but according to Solar Analytics (which monitors my hot water as a bonus it of info), that’s also using about 5-7kWh every day. So my hot water accounts for about half my daily energy consumption.
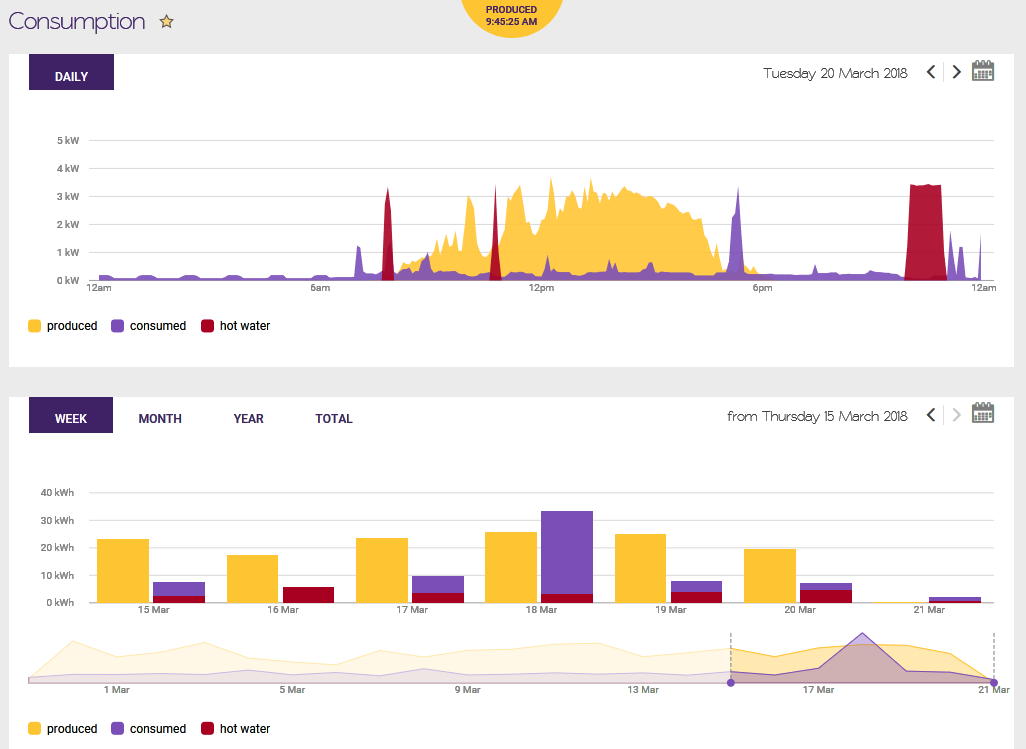
View of my energy consumption & solar production in Solar Analytics. The red areas denote water heating on a controlled load circuit.
Compare Solar & Battery Quotes
What’s my energy production ratio?
The more amazing thing is that, for the summer months so far, my home is producing significantly more energy than it’s consuming on the average day. The tallies I have going for the month of March to date (generated using Solar Analytics’ report export functionality) are outlined in the table below. As of now, we’re generating an extra 0.6kWh for each kWh that we consume (about 21kWh/day) – which means we’re net energy positive by a pretty good margin.
| My home’s energy consumption vs solar production
(1-20 March 2018) |
||
| Energy consumed (kWh) | Solar energy produced (kWh) | |
| Ordinary mains | 159 | 416 |
| Controlled load hot water | 106 | |
| Total: | 265 | |
| Energy production ratio: | 1.6 | |
Monstrous air conditioning
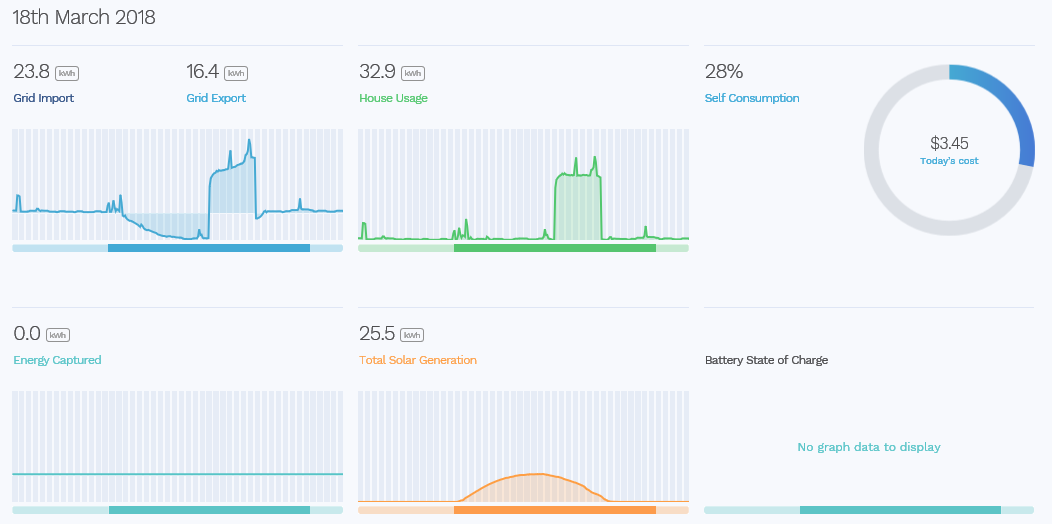
This is particularly remarkable in light of the fact that our 3-phase air conditioning unit is an absolute dinosaur: The last time we ran it (on the afternoon of Sunday the 18th), we managed to rack up over 30kWh of consumption (not even including hot water usage) – two to three times our daily average for the rest of the month. Fortunately, we generally only ever switch it on when the temperature exceeds 35 degrees – we’ve got a pretty high threshold for the heat, and a certain toddler in the house enjoys turning on fans anyhow.
(Here’s a fun thought: Imagine the stress it puts on the grid to have thousands upon thousands of these things pumping out cold air on a hot day in the middle of summer without solar on the grid to help make up for some of it.)
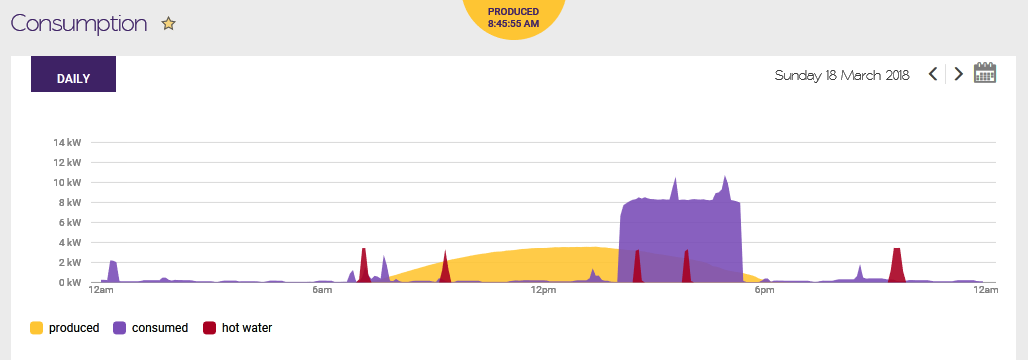
 Energy consumption & production on Sunday 20 March, when the AC was turned on during afternoon heat. (Solar Analytics above, Reposit First below.)
Gee wiz! Energy positivity must happen a lot!
I write this not to brag (although it is pretty cool and something to be happy about), but rather to point out that being net energy positive is probably a relatively common occurrence for solar homes – especially in the summer months and for homes that are relatively well insulated (which mine is not).
Although it may sound a bit naïve of me to say so – especially after writing for years about solar in Australia – it really hits home just how easy it is to be in this position. It’s incredible to think how many Australian households are producing significantly more energy than they are consuming.
Way to go, Australia!
The complications of controlled load/off-peak hot water
But what about hot water? My heating element is on a separate circuit from my mains (and solar), so that I’m always billed for all my hot water use – regardless of whether I had solar energy available at the time. This isn’t a huge deal, as most of the water heating happens overnight anyway, and I don’t pay much per kWh for my hot water (about 17c/kWh) since it’s on controlled load in the first place.
It does, however, have important implications when I start thinking about how much energy I’m producing for myself – my degree of energy self-sufficiency. I’ve generally got plenty of solar energy available during the day to heat my water, and we take evening showers so it makes the most sense to do the heating in late afternoon. But currently it’s impossible to meet my water heating needs with solar because of the separate circuit.
The table below compares my current rate of ‘energy independence’ (energy needs met with solar) only looking at my mains consumption vs looking at everything (including hot water). My current rate of actual energy independence is only 24%. I’m sure this will be closer to 30% or even 35% if I were able to schedule my water heater to run when the sun is shining. (To get much higher than this would mean serious behavioural change or adding batteries – neither of which are on the horizon for us.)
In fact, it’s part of my master plan to have my hot water on a toggle (or ‘booster’) between my mains and controlled load circuits – and once my carbonTRACK setup is complete and fully functioning I’ll be able to do with a relative ease using their ‘Green Circuit’ control functionality. (Looks like it will be another week or so at this point if all goes well.)
| Energy imported from grid (kWh) | Energy from solar (kWh) | % energy needs met locally | |
| Ordinary mains only | 95 | 65 | 41% |
| Mains plus hot water | 201 | 24% |
What would be even more impressive, however, would be to add on solar hot water and dramatically reduce the need to heat water with electricity in the first place. Then we’d be exporting another 5-7kWh back into the grid on a daily basis, making us even more energy positive (and with even lower bills). But with lots of other little projects on I’m not sure we’ve got the money (or the roof space) to make this happen, so for the time being heating with electricity it is.
Being energy positive means you (probably) save lots of money
With solar feed-in tariffs what they are these days (mine is about 13c/kWh with Energy Locals), it’s relatively easy to chew into my daily supply and usage charges just by sitting back and letting my solar system do its thing on a sunny day.
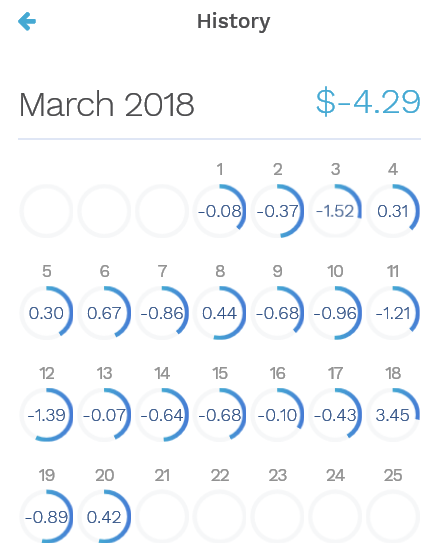
Although it doesn’t track my controlled load hot water usage (which, of course, it outside of my control), Reposit’s web portal does an amazing job of telling me how I’m doing (energy spend-wise) on a given day or in a given month. As per the screenshot below, I can see that my electricity charges for the first 20 days of March are almost five dollars in the negative – which would mean a net bill credit if not for the hot water charges.
It’s also pretty cool to see a minus sign in front of the electricity spend for 14 out of the 20 days, and all but one of the days with a total charge of less than $1. (The exception being the sweltering Sunday when we turned on the AC.)
This fleeting summer sun
And then to end with the caveat that the period of time discussed in this article covers some of the longest days of the year – which means that the energy positivity (and bill negativity) that we’re enjoying now may in fact be an artefact of the season.
Maybe it’s best to check back again in August to see how we’re faring when we’re heating our under-insulated house with the same beast of an AC unit and about half a dozen strategically placed column heaters while the sun goes down at 5pm.
Join our mailing list to follow along
Get a free, instant solar & battery quote comparison
Compare Solar & Battery Quotes
© 2018 Solar Choice Pty Ltd

He is now the communications manager for energy technology startup SwitchDin, but remains an occasional contributor to the Solar Choice blog.
James lives in Newcastle in a house with a weird solar system.
- Solar Power Wagga Wagga, NSW – Compare outputs, returns and installers - 13 March, 2025
- Monocrystalline vs Polycrystalline Solar Panels: Busting Myths - 11 November, 2024
- Solar Hot Water System: Everything You Need to Know - 27 February, 2024