If you believe everything you read in the press, you’d think that solar power in NSW was dead and buried. There is reduced upfront federal assistance (RECs, STCs) for homeowners to buy solar panels and a reduced solar feed-in tariff from the sudden conclusion of the NSW Solar Bonus Scheme. Others have an optimistic outlook. They’d have you think you’re mad for not getting a system. The truth is somewhere in the middle. There is actually a well defined ˜sweet spot’ for solar, depending on your patterns of electricity use. (By Stuart Gordon, Solar Questions.)
In NSW, whether to get a solar system now depends on when you use your electricity
Put simply: solar power is economical for you if your solar system produces enough electricity to power your daily household power demand.
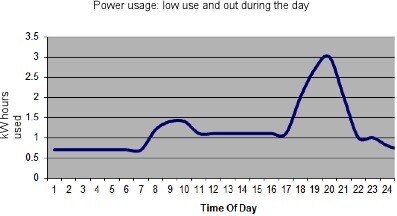
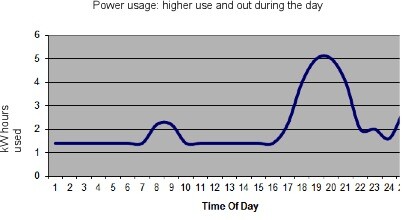
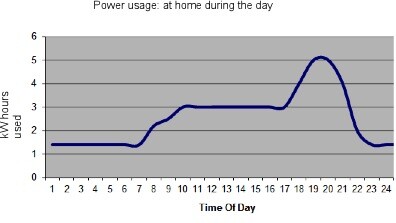
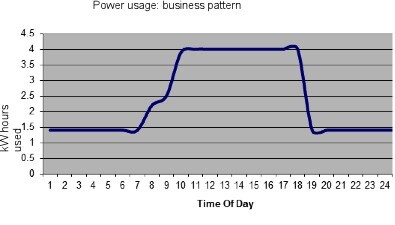
The following are graphs that illustrate usage patterns for three types of home and a business. The first two show usage for families that are out during the day. By identifying which one is closest to your daily use, you can identify if a solar power system might be economical for you in NSW–even without a feed-in tariff.
Household A: Lower power consumption during the day, higher at night. (All occupants outside the house during the day.)
Household B: Even higher electricity usage at night. (More occupants than household A.)
Household C: Fewer occupants at home during the day, more at night. (Stay-at-home parents, home office.)
Business: Occupants arrive in the morning and leave in the afternoon. Power consumption is steady throughout the daytime.
Let’s compare these usage patterns to 1.5kW and 3.0kW solar systems. Numbers are approximate, as actual system output depends on factors such as system size and effectiveness (orientation, shading) but the pattern is always the same bell shaped curve. When we overlay two of these, we can see the impact.
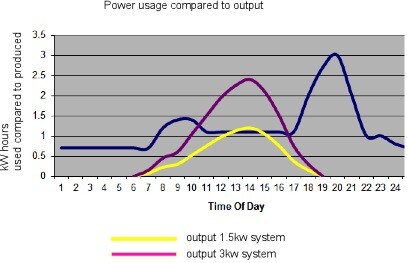
As an example, the graph below shows a 3kw system (which will produce about 12kWh per day on average, depending on where you live) and a 1.5kw system displayed in comparison with Household A’s pattern of electricity use.
Overlay of Household A electricity consumption against a 1.5kW solar system (yellow) and a 3.0kW solar system (purple).
Offsetting your power consumption by consuming the power directly from your solar system: net metering
As you can see, if you use a lot of power then the ˜export to the grid’ may not even happen: you’ll consume it all yourself, thereby saving yourself the money you would otherwise pay for electricity from the grid. There are many homes that use 40 kWh or more a day. If this is the case for you, you are still taking advantage of all the power generated from a 3kw system (around 12kWh/day) during the day.
If you are using this power then you’ll find that the actual cost of power plus the expected rises in energy prices will give you a great return on your investment, in many cases a pay back time of about eight years.
Consider how you are billed for your electricity usage in the long-term:
Many homes are on a tiered, two-step pricing billing plan “ they pay a lower price for the first allocation of power then a higher rate. For example you may pay 22c for the first 1300kwh, then jump to 25c above that. By using solar power, you might stop yourself being charged that higher rate, thereby increasing the financial benefit for home.
If you compare this to the situation of people who bought systems in 2010 and who are set the 60c tariff until the scheme expires in 2016, you’ll see that current purchasers of larger systems are doing nearly as well. Despite lower upfront assistance, some larger systems are less expensive than before–thanks to cheaper panel prices and a record-high Aussie dollar. Because peak power prices are as high as 40c per kWh now, (and within 3 years may be as high as 60c) there is good reason to invest in solar power.
In fact, because the lifetime of an average solar system is 25 years+, the longer you have the system, due to the expected higher electricity prices, the return on investment rises over time. For example, by the 10th year of ownership, the return on investment on your original purchase price will probably be 15% per annum or more.
Written by Stuart Gordon
For a more in-depth analysis about the economics of buying a solar power system in NSW, please see the full version of this article on the SolarQuestions website.
I paid approx $16.000 for a 3kw system installed in March 2010 it has produced up to 19kw per day in summer and as low a 2kw per day in winter ,or an average of 8 kW per day since installed , this means I will still be approx $4000 out of pocket when the 60cents per kilowatt ends this December , lucky I paid cash and didn’t have to pay interest.
I can’t understand why the NSW goverment doesn’t legislate a 20cents minimum feed in as this is still lower than what we pay for electricity , and the network charges are still a cost paid to the retailers no matter how much electricity we use
We absolutely agree, Bert – better feed-in rates would not only be good for customers like yourself, but also for the solar industry as a while!
In the meantime, however, what we recommend to our customers is to focus on self-consuming as much of their solar energy as possible – that is, using energy while the sun shines. There are a few options for doing this, all of which are neatly wrapped up in our recent article about options for NSW homes coming off the Solar Bonus Scheme at the end of this year.