If you are in a grid-connected home and want to get batteries for your rooftop solar system, you’re probably wondering how much capacity to have installed. Although the ultimate answer comes down to your personal preferences and goals, what about if you’re primarily after a good return on your investment? In this article we’ve endeavoured to answer the question, ‘What size battery bank makes the most sense for a grid-connected solar home?’ The short answer is ‘a small battery bank’.
When batteries make sense
Although solar PV systems are quite affordable on their own, batteries are still pricey. For pretty much any battery product with a 10-year warranty, you’re looking to pay in the range of $2,000 per every kilowatt-hour (kWh) of capacity installed. These costs are likely to fall sharply in the coming years (especially for lithium batteries), but this looks like it will remain true for at least the rest of 2016.
Let’s say you’re dead set on having batteries installed in your home as soon as possible, but in addition to the many other reasons a battery bank might already be attractive, you also want to make sure it’s a solid investment? Fortunately, there are a few scenarios in which a battery bank already ticks both of these boxes; in the case of a typical grid-connected solar system, the key is keeping it small.
Compare solar & battery storage quotes from installers in your area!
Compare Solar & Battery Quotes
Using PVSell, we’ve looked at how an example home would fare with a range of battery bank sizes and two popular storage products (Tesla Powerwall and Enphase Energy’s AC Battery), both of which have a 10 year warranty.
The sample home has the following features:
- Average electricity consumption of 30kWh per day (on the high side for a residential property).
- Located in Sydney, with north-facing roof and no shading.
- Is going to install a (or already has) 4kW solar system, costing approximately $5,250 (incl GST and incorporating the federal solar ‘discount’).
- Some people in the home during the day, but energy usage peaks in the evening.
- The home is on a time-of-use billing arrangement, so it can ideally benefit from cycling the batteries up to twice a day.
- Electricity rates: 41c/kWh peak, 16c/kWh shoulder, 10.5c/kWh off-peak, daily supply charge of 80c, and solar feed-in rate of 5c/kWh (from a plan on EnergyMadeEasy).
- When batteries are installed, they’re discharged only during peak & shoulder times in order to maximise the value of the stored energy.
(N.B. All scenarios and outcomes below are indicative only and do not constitute financial advice.)
Exhibit A: Grid-connected home with 4kW simple solar PV system (no batteries)
Solar shines on its own with a payback period of 6.5 years. This could easily be shorter if the home finds a way to put all of the solar energy to work (currently, about 40% would be exported to the grid at a meagre rate of 5c/kWh). Installing a home energy management system or hot water diverter could do the trick. Even without one of these devices, however, the home directly meets about 47% of its electricity needs with solar – although it generates enough solar energy in total to meet nearly 60% of its needs if all that solar energy were put to direct use.
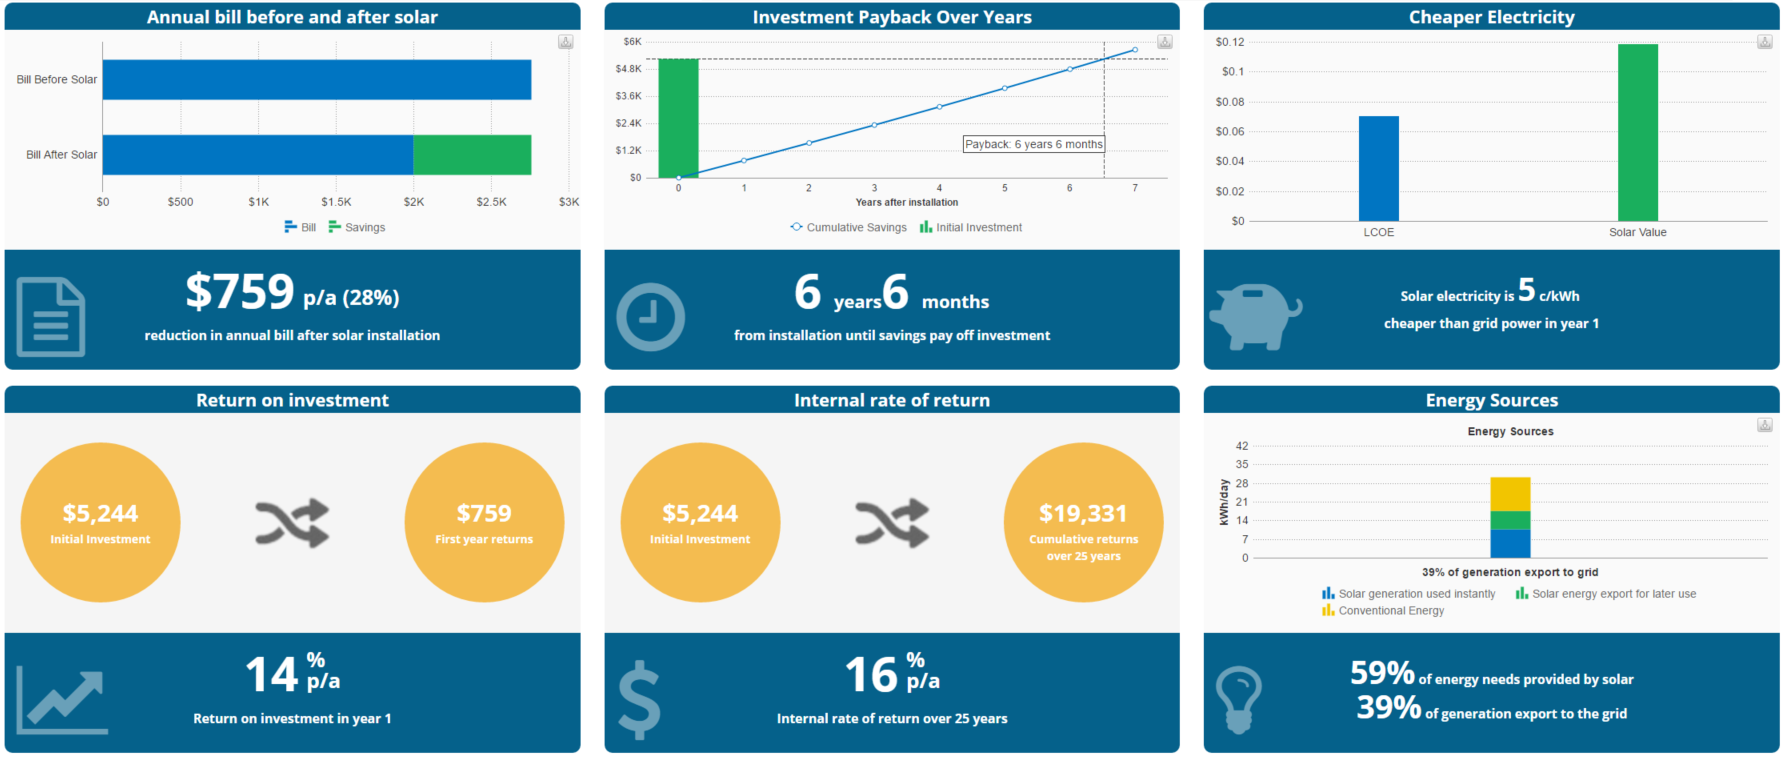
Indicative payback period & return on investment for a 4kW solar system without battery storage (plus some other useful stats). (Click to enlarge – table generated using PVSell.)
Exhibit B: Tesla Powerwall (6.4kWh usable)
Now let’s add one of Tesla’s Powerwalls to the mix – an additional cost of $9,000, assuming that the system’s inverter is battery-compatible (a retrofit might be more expensive). The Powerwall’s capacity comes in at 6.4kWh (usable) at least for the first year, and it’s ability to discharge power at a high rate allows it to match peak afternoon demand with relative ease. Since the Powerwall is only intended to be cycled once daily, it should really only be charged with the sun (i.e. no or only minimal grid charging).
In this scenario, according to PVSell’s outputs, the payback period for this system would be about 12 years. The battery covers a good portion of the home’s peak energy demand, allows the home to generate and use roughly half the energy it consumes. However, since it only charges with the sun, there may be parts of the year where the battery never reaches a full state of charge – and the less the battery works, the less value it delivers to the home. Ideally, you want your battery that will do useful work (full charge/discharge cycle) 365 days of the year.
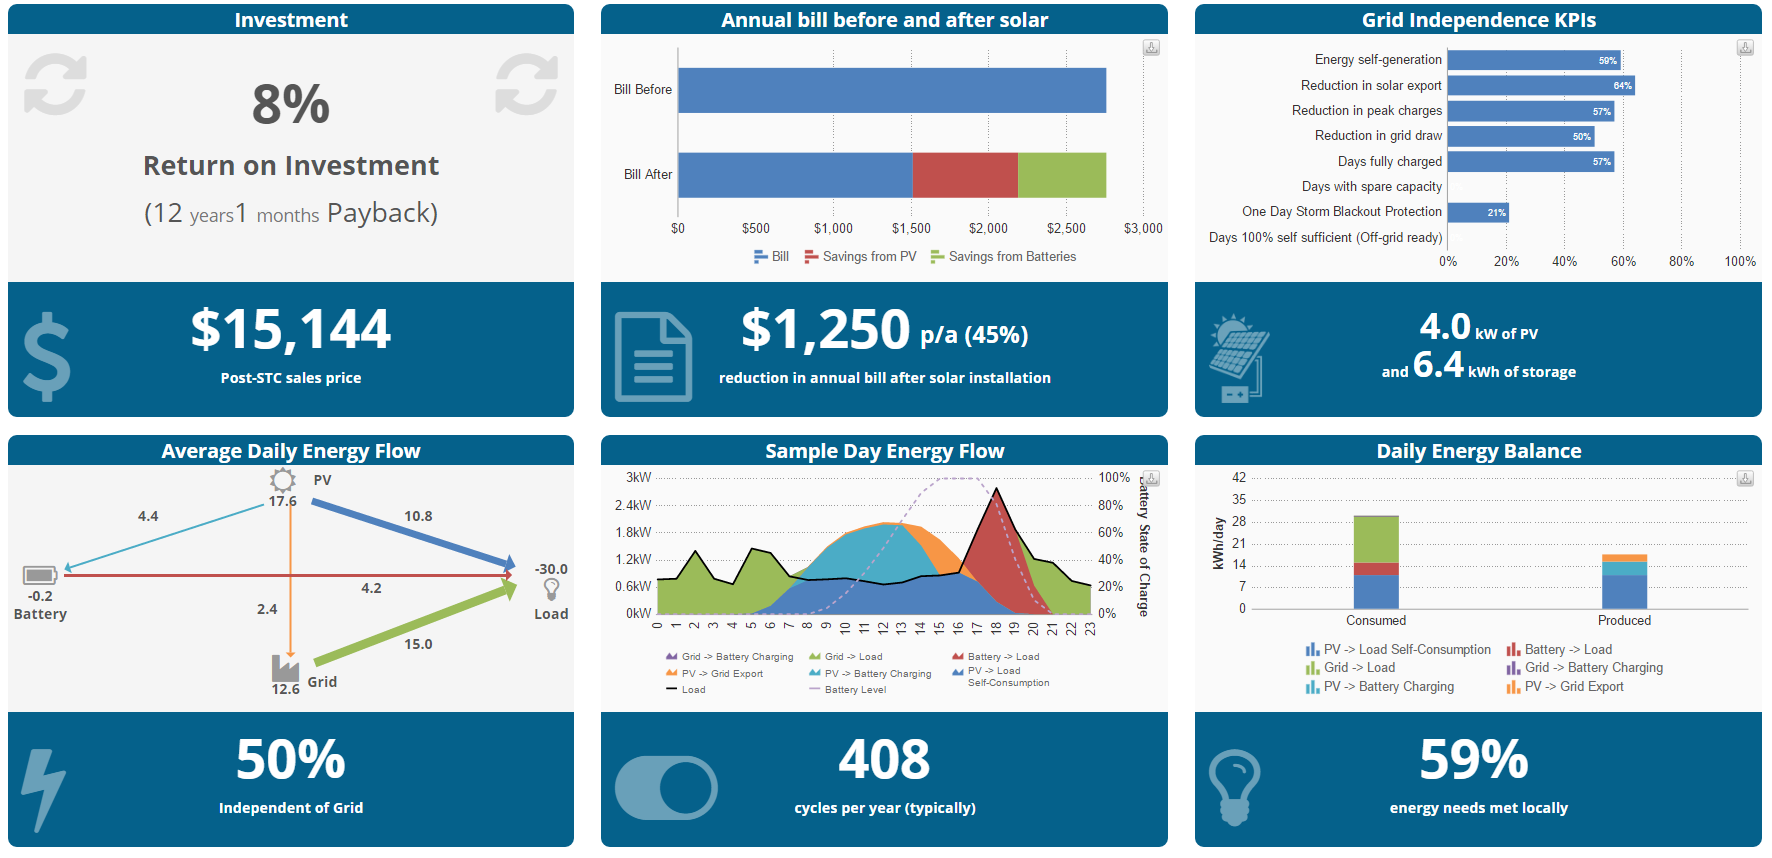
Tesla Powerwall, charging only with the sun. (Click to enlarge – table generated using PVSell.)
One way to improve the rate of battery usage is to do some off-peak ‘pre-charging’ with the grid. This is not the job of the battery itself, but rather the system’s inverter, which may be able to do this either now or in the near future (let’s assume it can). But how much should you charge up the battery with the grid, especially considering the fact that you’d probably want to charge it up as much as possible with the sun? Exploring some different scenarios, we determined that charging it up to 100% would likely deliver the best returns – although a ‘smart’ energy management system that can make decisions based on weather forecasts would probably deliver more nuanced performance and better value on the system.
In effect, grid pre-charging means that only a portion of the charging is done with solar – something that would be counter-intuitive to most of us who assume that the whole point of having batteries is to charge them with the sun. We should also note that it might mean that the Powerwall is cycled more than once per day over its lifetime (equal to about 3,600 cycles over 10 years), which is not explicitly allowed by Tesla.
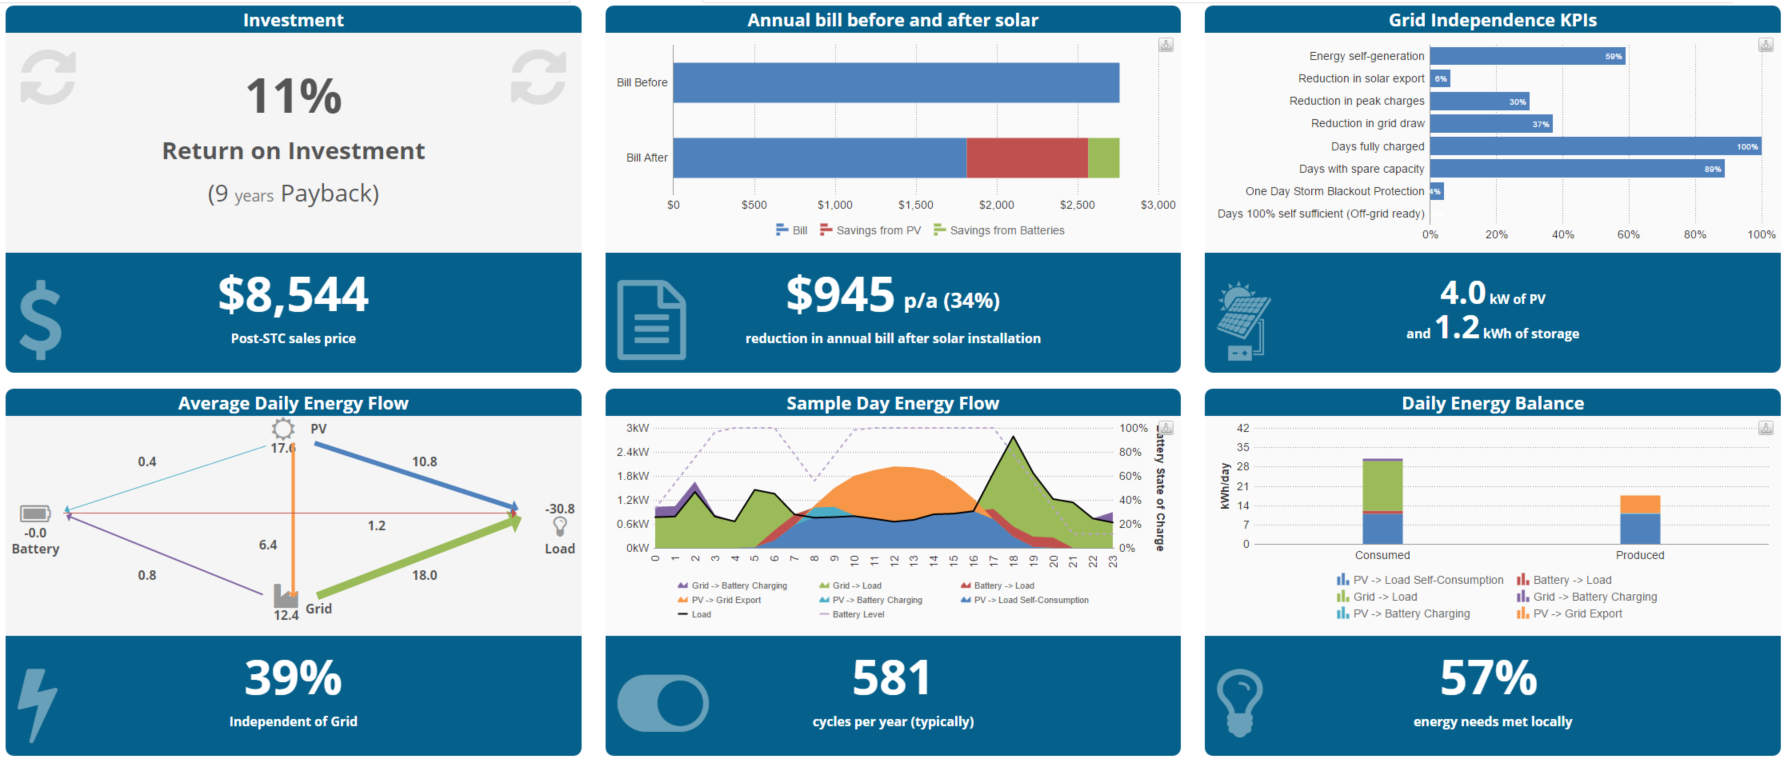
First, let’s see what happens if we pre-charge in the morning to 30%. As the table below shows, the payback is now down to about 10.5 years – a definite improvement. This gives a hint of what ‘smart charging’ could do to improve the system’s payback.
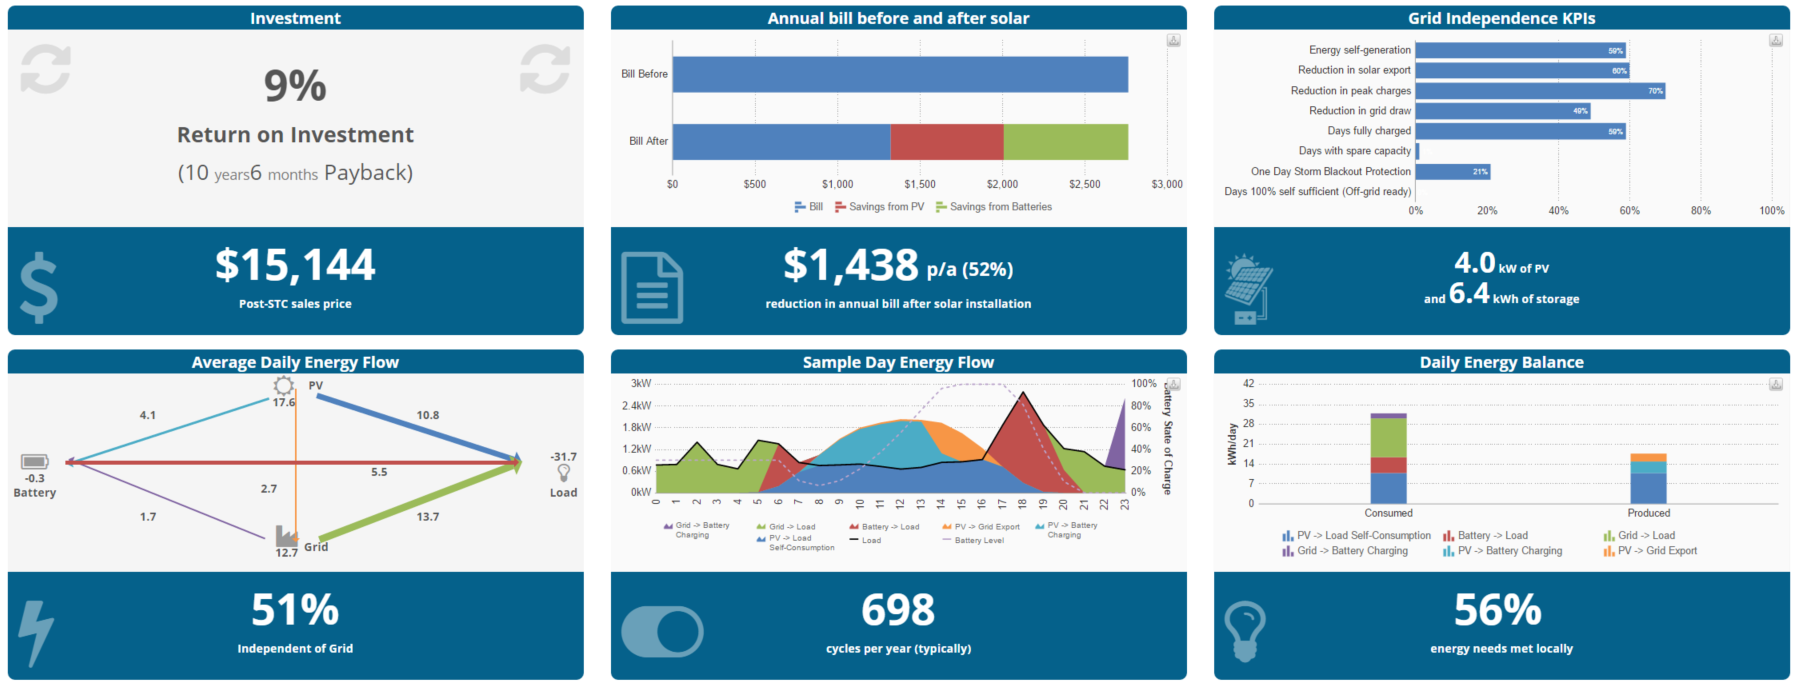
Telsa Powerwall, with 30% pre-charging daily. Returns are better than with the solar charging-only scenario above. (Click to enlarge – table generated using PVSell.)
What happens if we now increase the pre-charging rate to 100%, just as an experiment? The results get even better, with a payback of just under 10 years and even bigger electricity bill savings. But again, keep in mind that this could mean that the Powerwall is not intended to be charged/discharged more than once a day.
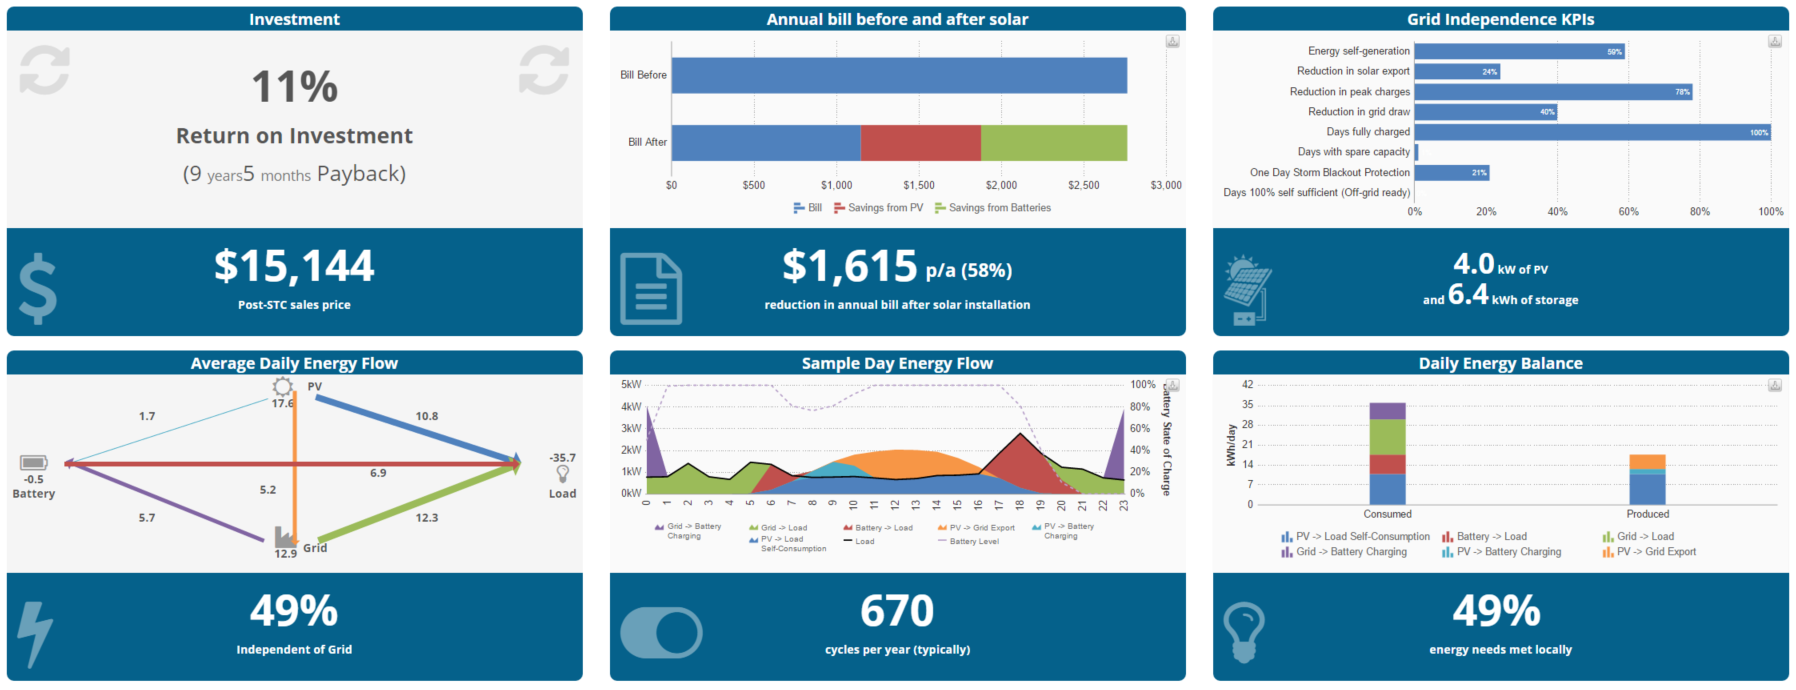
Tesla Powerwall, with 100% pre-charging daily. Returns are even better than 100% pre-charging, despite the fact that only a small amount of solar energy generated ends up charging the battery. A smarter, predictive charging algorithm would help to maximise solar usage and improve returns. (Click to enlarge – table generated using PVSell.)
Exhibit C: Enphase AC Battery (1x – 1.2kWh)
Now let’s look at the smallest battery bank available on the market. Enphase Energy’s AC Battery has a capacity of 1.2kWh and its own in-built inverter (i.e. no ‘doubling up’ with the solar inverter). A single unit may cost roughly $3,000 to install, given the one-off communications infrastructure that might be necessary to make it work with the rest of the system (each additional unit would cost less). Because the battery is so small, it can theoretically be pre-charged to 100% and fully cycled twice a day (although in practice this may not happen every day). Its peak output is significantly lower than the Powerwall’s, even with multiple units in place, which means it has a hard time ramping up to meet full peak demand (see Exhibits D & E below).
As the table below shows, a single Enphase AC Battery would have a payback of about 9 years for this home, but the overall annual savings would be significantly lower. Off the bat, we can see that while this is nominally a better investment and does make a notable impact on electricity bill savings, it actually has very little impact on the home’s energy independence. One benefit of the AC Battery, however, is that it would be very easy to install more of them at any point in the future – and they are expected to cost quite a deal less in the near future.
If fitted out with a 1.2kWh Enphase AC Battery at $3,000, the system would deliver a payback of about 9 years – just under the warranty period of the battery. Again, a smart charging regime could improve this significantly. (Click to enlarge – table generated using PVSell.)
Exhibit D: Enphase AC Battery (2x – 2.4kWh)
When we double the battery size to 2.4kWh (2x Enphase AC Battery units) at $5,000, the bill savings and energy independence ratio both increase – but the so does the payback period (albeit just a little bit, and it’s still under 10 years). This appears to be due to the fact that the battery bank – fully charged by the grid before the family wakes up – does not have the chance to empty itself out before the sun comes up for a full solar refill. Interestingly, reducing the pre-charging rate only extends the payback period further – a function of the big difference between off-peak & peak electricity rates.
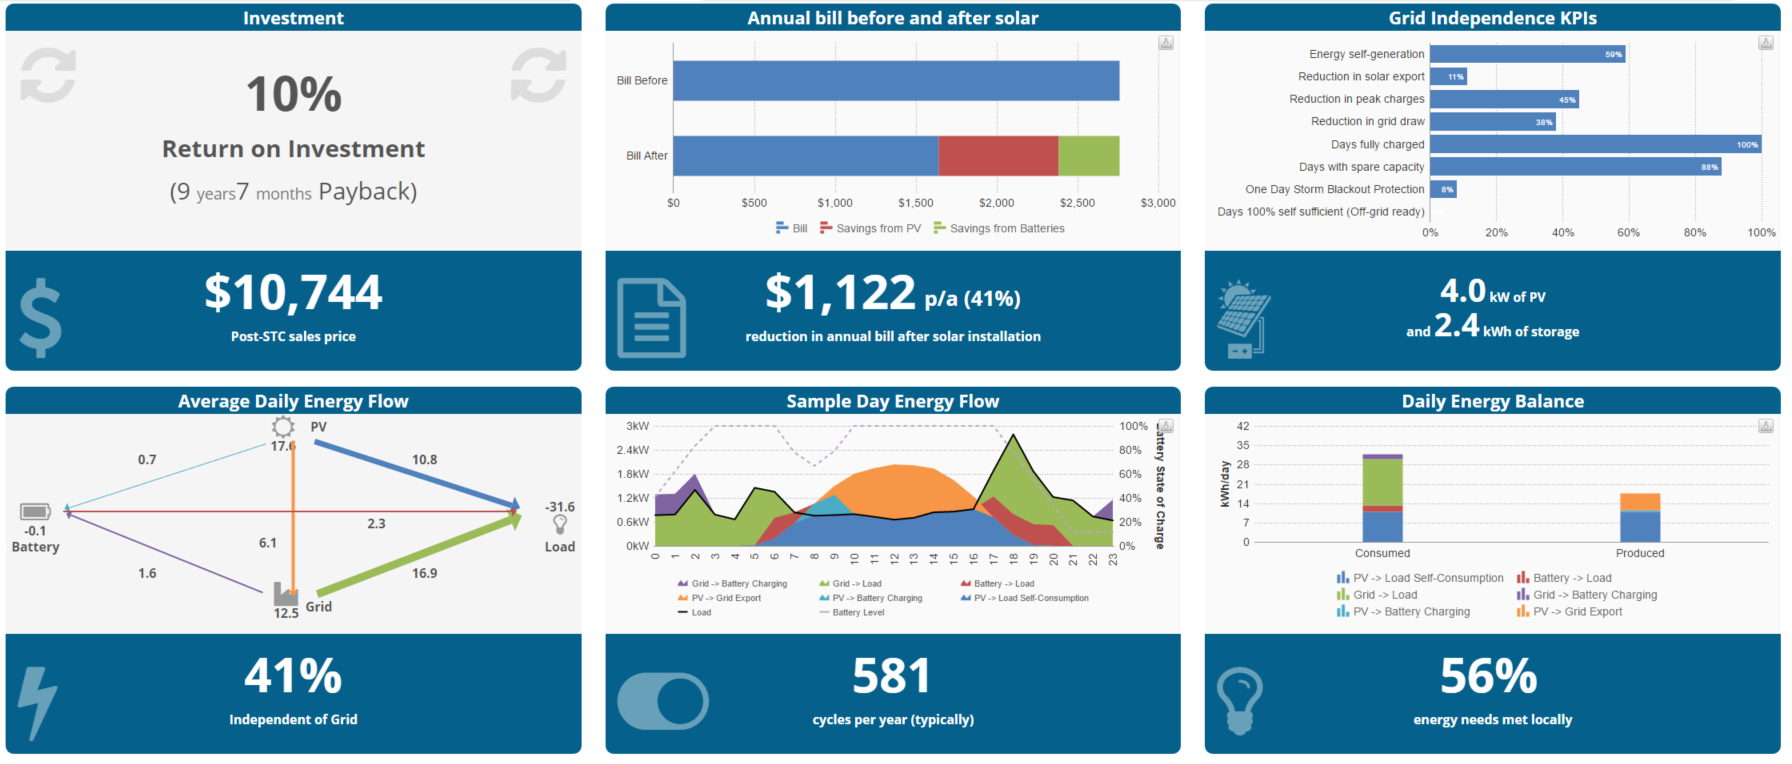
If fitted out with a 2.4kWh Enphase AC Battery at $5,000, the system would deliver a payback of just under 10 years. This could potentially be improved with learning, ‘smart’ energy management software. (Click to enlarge – table generated using PVSell.)
Exhibit E: Enphase AC Battery (4x – 4.8kWh)
In this scenario we see annual savings jump again, but a payback period (almost 11 years) that is now longer than the warranty period (about 10 years). As with the scenarios above, the extension of the payback period has to do with the battery bank’s inability to fully discharge before the sun kicks in to charge it again (less available battery capacity during the day).
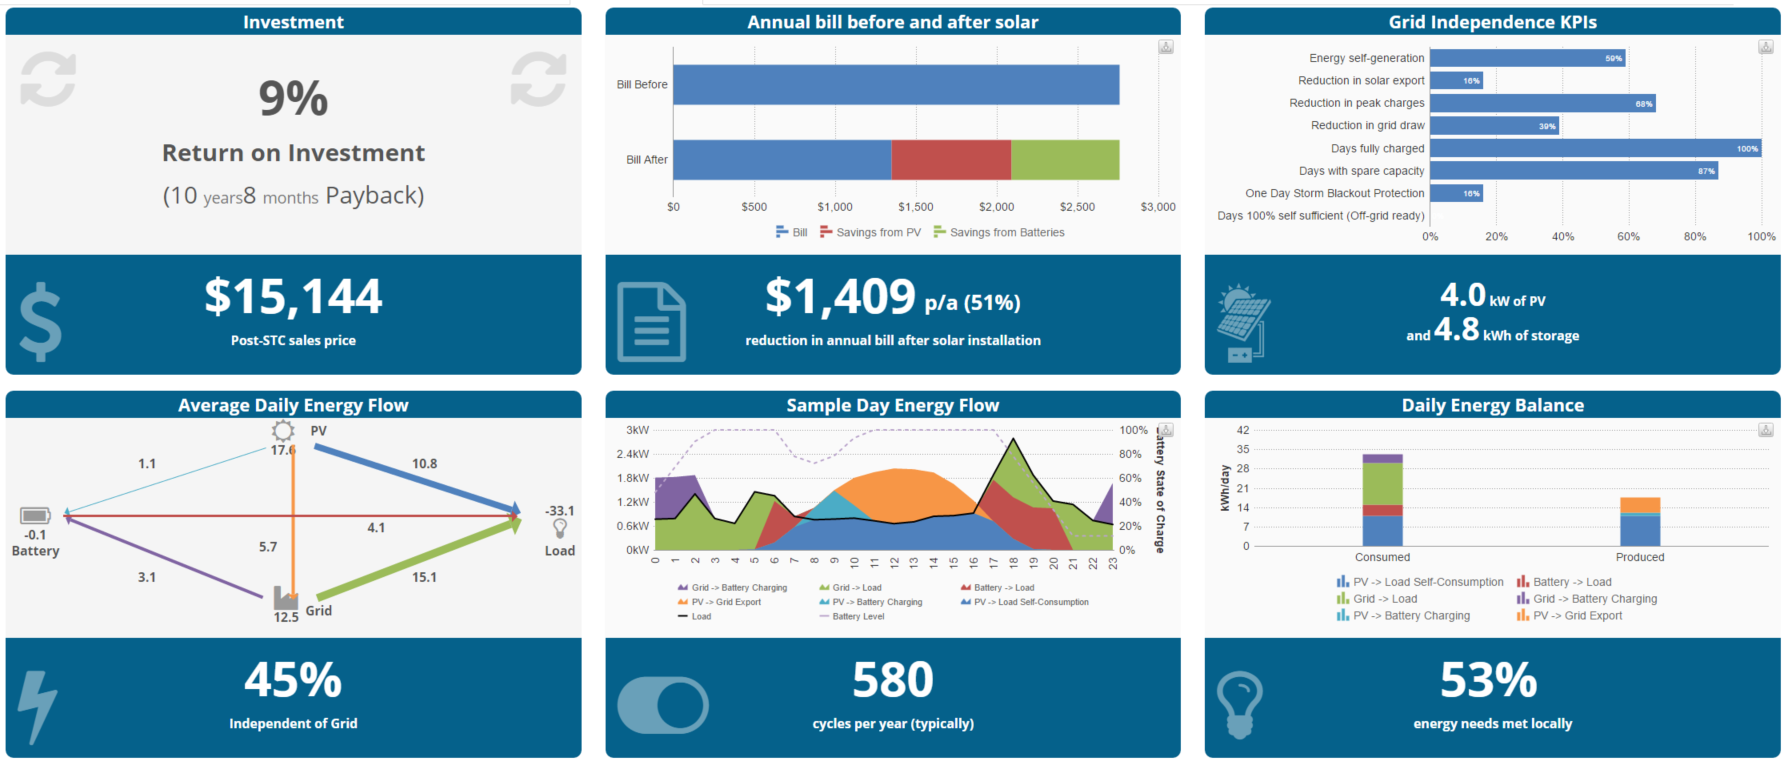
If fitted out with a 4.8kWh Enphase AC Battery at $9,000, the system would deliver a payback of under 11 years. (Click to enlarge – table generated using PVSell.)
Key takeaways: Battery storage sizing for grid-connected homes
- First off: Remember that we’ve only modelled one scenario here: Your home could have different energy consumption levels and patterns, as well as a different solar system size. The best thing to do is consult an installer and/do some investigations of your own. (You’re welcome to play around with our own Battery Storage System Sizing Estimator, which is free.)
- A solar PV system on its own currently promises better returns and a shorter payback period than a solar-plus-storage system.
- If you’re primarily concerned with increasing your energy independence and reducing your energy bills, get a larger battery bank. However, a smaller one will most likely deliver better returns.
- Being on a time of use billing arrangement will help you maximise the value of your stored energy – you can buy energy from the grid when it’s at its cheapest and rely on your solar & stored energy when grid energy is expensive.
- Currently, it is possible to get payback periods under 10 years for a solar & battery storage system – but you’ll stand a better chance of doing so if you do some ‘pre-charging’ of your batteries with the grid, which not all systems are equipped to do (ask your installer).
- Cycling your battery twice a day will help to reduce your system’s payback period. This means: charging during cheaper, off-peak times with the grid, discharging during the morning peak, and then charging again with the sun so that you have some energy stored for when the evening peak comes around.
- In reality however, twice daily cycling may not be easy to achieve unless you have uncommonly high electricity usage, especially in the morning. A good approach would be to ensure that your inverter or energy management system is ‘smart’ enough to know when to pre-charge and when to not.
- Once battery storage prices get down to half of where they’re at now (as Enphase has predicted they will by 2020), returns will look significantly better, and payback periods well under 10 years will be commonplace.
Ready to shop for solar or battery storage? Compare quotes from installers in your area.
Compare Solar & Battery Quotes
© 2016 Solar Choice Pty Ltd

- Solar and EV Charging Installation for Apartment Building in Brisbane - 20 May, 2025
- Heat Pump Hot Water System Rebate Victoria – Explained - 19 May, 2025
- Heat Pump Hot Water System Rebate NSW – Explained - 14 May, 2025
Hi there,
Great article, wish I’d found it earlier!
There are some errors in your calcs/graphs that I’d just like to point out:
– sample day energy flow doesn’t show the last slice (hour 23-24h)
– daily energy balance double counts the battery consumption. While the battery supplies load it doesn’t generate, so its contribution to the load shouldn’t be added to total consumption. This should increase the self-sufficiency that you’re reporting, so it should be good news.
Thanks again for the great illustration of battery use.
Thanks for the comments, Manuel – I’ll pass this on to SunWiz, who are the ones that created the PVSell software that I used to create those graphs.