Four charts put together and tweeted over the weekend by clean energy industry veteran Ray Wills have illustrated just how quickly the transformation of the global energy market is happening.
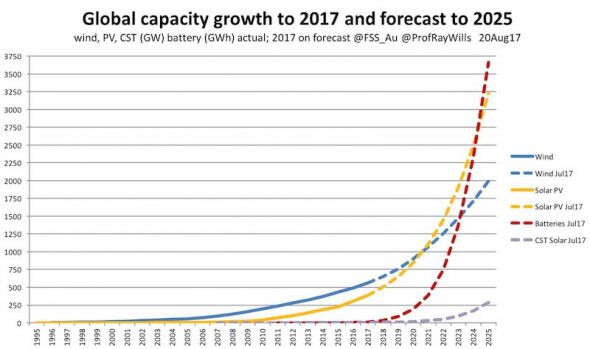
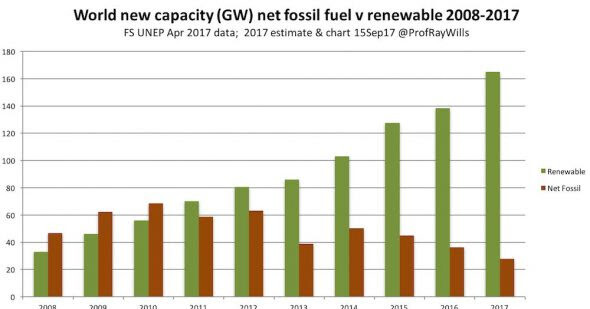
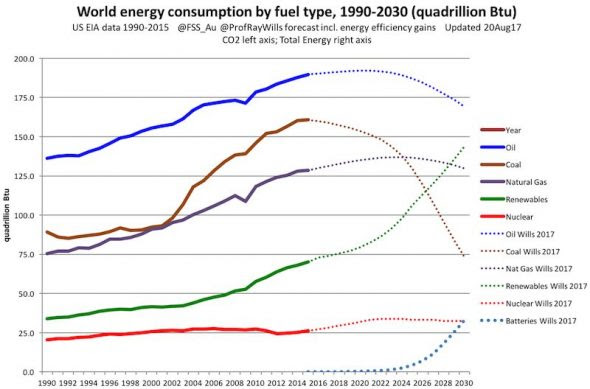
In the first chart, on global capacity growth, coal power does not feature at all. It does, however, feature in the following three charts, but it charts a different path to the competing renewables.
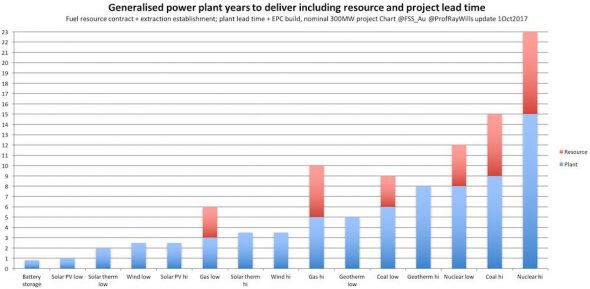
In the Australian context, graph two, measuring the time it takes to deliver different types of power plant, is particularly interesting, considering recent projections about the future energy mix under the proposed National Energy Guarantee.