Average residential solar system prices have risen slightly following two consecutive months at their lowest levels since Solar Choice began keeping track in August 2012.
This month’s higher average price – $1.55 per watt, as opposed to $1.45/W last month- is undoubtedly due at least in part to the recent drop in STC values and therefore the federal incentive for small-scale solar. The increases were observed in every capital city as installers adjusted their pricing upwards to partial make up for the reduced subsidy.
(N.b. Even with the increase, average prices till sit significantly lower than all historic data points before June 2017.)
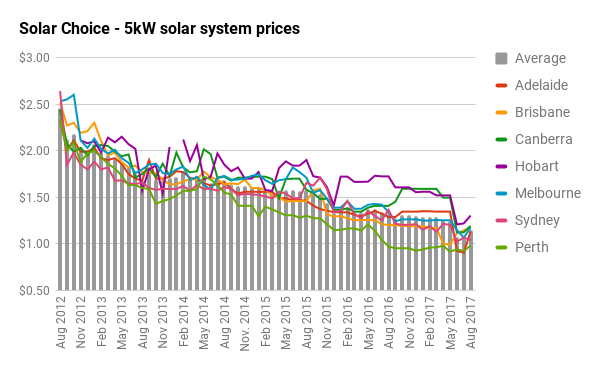
This month also marks the fifth birthday of the Solar PV Price Index. Since August 2012, we’ve seen average system prices fall roughly 40% from about $2.40/W to $1.44/W. The average price of a 5kW solar system (currently the most popular system size in the country), meanwhile, has declined by nearly 55% to $1.14/W, or about $5,700 for a fully installed system. A similar system installed in 2012 would have cost about $12,300.
Average solar PV system prices for August 2017
Prices in the table below include both the up-front incentive available for small-scale systems through the Renewable Energy Target (STCs) and GST – they represent the total out-of-pocket cost of the system to the customer. We’ve left fields blank where there were only a small number of price points available in our database (usually fewer than 3).
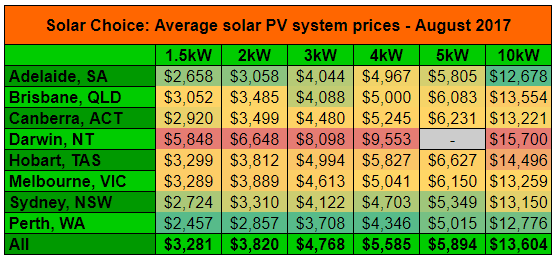
Prices for each system size are colour-coded. (Dark red for highest, dark green for lowest, yellow for middle. Note that for Darwin there is no 5kW pricing; this is because Darwin installers prefer to list pricing for 4.5kW systems instead, as there are additional hurdles for connecting solar systems above that size to the grid. We have recently revised our table to more accurately reflect this.)
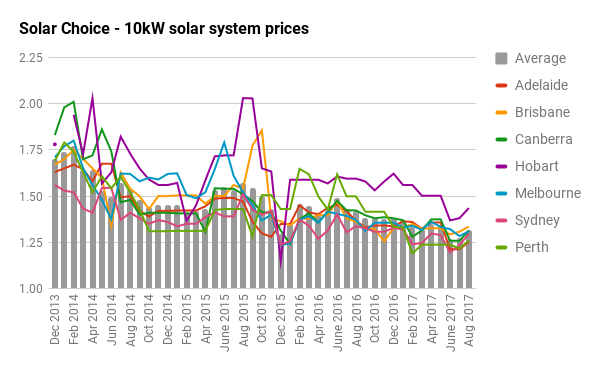
Solar system prices for August: $/W medians, highs & lows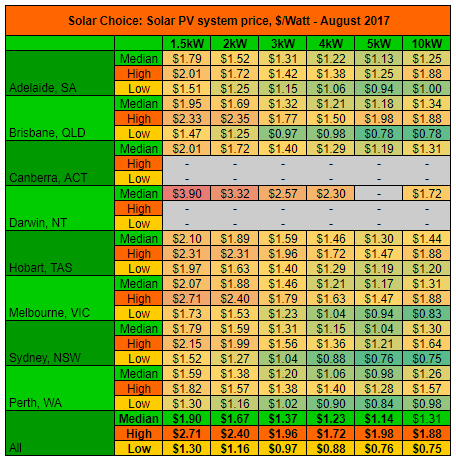
Prices above are colour-coded across highs, lows & medians for all cities and system sizes. (Dark red for highest, dark green for lowest, yellow for middle. Cells are grey where only a small set of data points was available.)
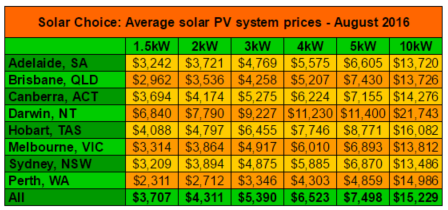
Historic solar PV system prices (since August 2012)
The historic pricing in the tables below do not reflect prices for Darwin, NT. See ‘About this data’ footnote below for a more detailed description of where this data comes from and what it represents.
All $/W solar system prices (Historic)
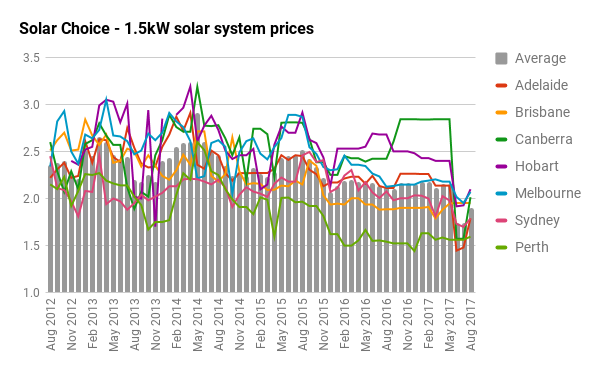
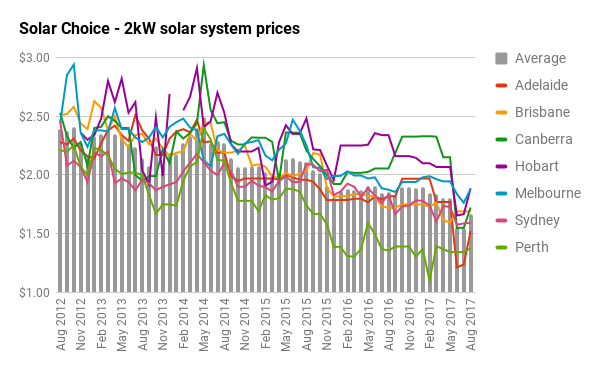
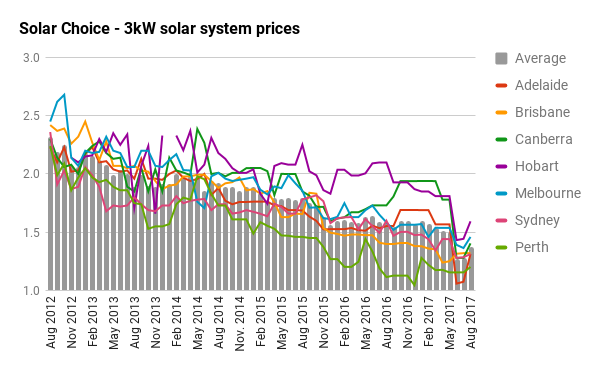
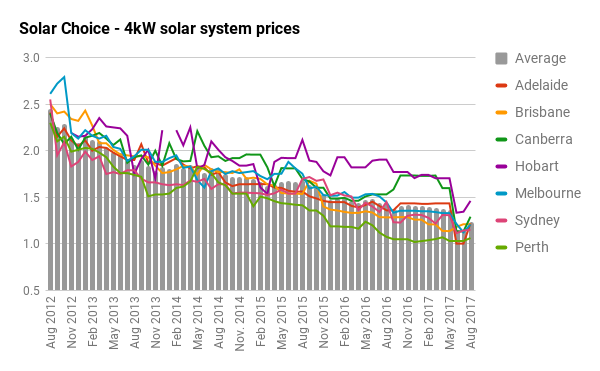
The chart below provides an at-a-glance look at solar PV system pricing trends since August 2012. Data points are the average of average $/W for each system size (1.5kW-5kW until Nov 2013, then also including 10kW from Dec 2013).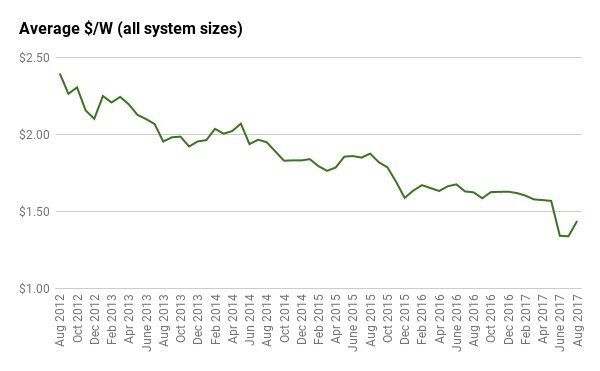
(N.b. Please see note about ‘Solar Choice Discount’ in January 2016 edition of the PV Price Index.)
About this data
Tables and charts included in this article were compiled using data from Solar Choice’s installer network database, which contains regularly-updated pricing and product details from over 100 solar installation companies across Australia. Prices do not ordinarily incorporate meter installation fees or additional costs for difficult installations. ‘Premium’ installer offerings are excluded from calculations. Pricing data from Darwin is not included any of the charts showing historic trends.
© 2017 Solar Choice Pty Ltd

- Solar panels Newcastle, NSW: Compare prices & installers - 26 July, 2024
- Solar Panels For Home – All You Need to Know About Solar Systems - 26 July, 2024
- Top 5 Problems with Cheap Heat Pump Installations & How To Avoid Them - 25 July, 2024