The Solar Choice Price Index measures the cost of solar power systems on a dollar per watt ($/W) basis. This pricing metric helps consumers and industry stakeholders understand the average prices of residential solar system installations across different regions in Australia. The price per watt is a key factor in comparing the cost-effectiveness of solar power systems, considering the total cost of installation divided by the system’s capacity in watts. This index can provide insights into trends in solar pricing, influencing decisions for potential solar energy adopters by highlighting the average upfront investment required to install a solar photovoltaic (PV) system.
Solar Choice has been publishing the Solar Panel Price Index for residential solar & commercial-scale solar since 2012 and 2014, respectively. We regularly compile pricing & product and warranty information from our pre-vetted network of over 200 installers to produce the Residential Solar PV Price Index and Commercial Solar Price Index. We update this information monthly to help Australians understand – how much do solar panels cost.
Our price index is used frequently as a benchmark to residential customers and businesses as Australia’s best guide on how much solar panels cost and is included in reports derived by industry experts such as UNSW, SunWiz and Bloomberg NEF.
The below table shows the average solar panel cost by city & size of solar panels installed (DC). The prices in all the below tables include the up-front incentive available for small-scale systems through the Renewable Energy Target (i.e. ‘STC discount’) and GST – they represent the total retail price of the system to the customer.
3kW
4kW
5kW
6kW
7kW
10kW
Adelaide, SA
$3,710
$4,090
$4,490
$4,930
$5,670
$7,520
Brisbane, QLD
$3,920
$4,420
$4,860
$5,320
$6,360
$8,300
Canberra, ACT
$3,710
$3,980
$4,200
$4,630
$5,570
$7,100
Darwin, NT
$4,730
$6,780
$7,600
$9,320
$10,060
$13,060
Hobart, TAS
$4,620
$5,400
$6,030
$6,750
$7,240
$10,830
Melbourne, VIC
$3,960
$4,450
$4,950
$5,450
$6,280
$8,300
Sydney, NSW
$3,630
$3,960
$4,510
$4,960
$5,730
$7,540
Perth, WA
$3,260
$3,640
$4,090
$5,000
$5,730
$8,770
All
$3,940
$4,590
$5,090
$5,800
$6,580
$8,930
Compare quotes from up to 7 installers in your area now.
A commonly sized 6kW Solar PV System would cost between $4,000 and $6,000 in most states in Australia and a 10kW system would cost between $7,500 and $10,500. If you want to use top of the line products – see the premium solar system price table further down this page.
We ask each installer on the Solar Choice network to put down a standard offer and a premium offer. Solar installers generally have tiers of offers to cater to consumers on a budget, or consumers willing to pay more for higher-quality to products. The Solar Choice Price Index references the standard offer prices are these are most commonly selected by customers.
The average solar panel cost in the below table reflects the premium offers from the Solar Choice installer network. These systems come at a 20-30% higher price than the standard offers based on the higher cost of the underlying equipment.
3kW
4kW
5kW
6kW
7kW
10kW
Adelaide, SA
$4,960
$5,460
$5,910
$6,600
$7,660
$10,140
Brisbane, QLD
$5,160
$5,880
$6,380
$6,910
$8,110
$10,930
Canberra, ACT
$4,770
$5,270
$5,490
$6,000
$7,170
$8,900
Darwin, NT
$4,930
$7,330
$8,100
$10,330
$11,560
$15,460
Hobart, TAS
$5,720
$6,680
$7,830
$8,450
$8,920
$12,640
Melbourne, VIC
$5,260
$5,780
$6,420
$7,100
$8,080
$10,620
Sydney, NSW
$4,570
$4,980
$5,890
$6,350
$7,250
$9,850
Perth, WA
$4,470
$4,840
$5,350
$6,380
$7,410
$10,780
All
$4,980
$5,780
$6,420
$7,270
$8,270
$11,170
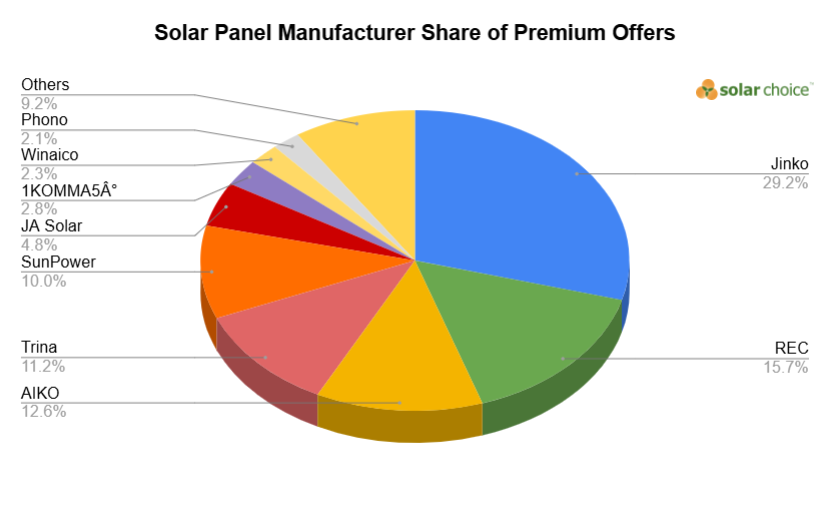
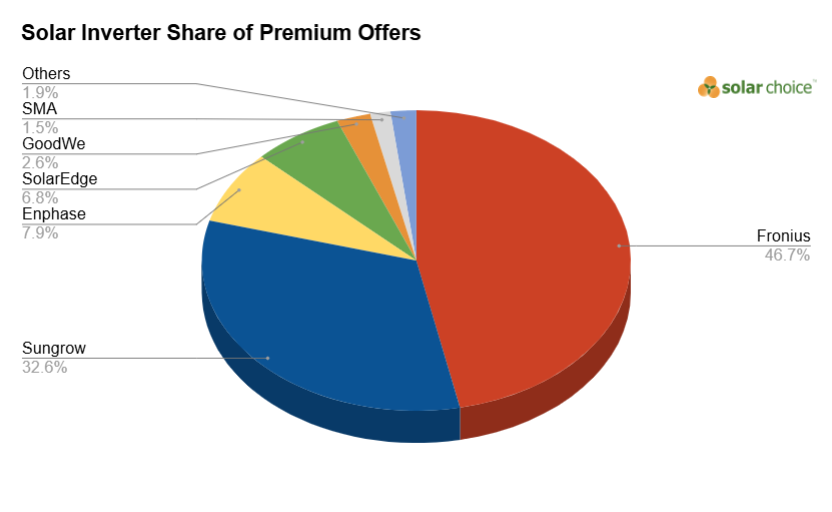
To give an idea of what is considered a ‘premium’ solar panel and solar inverter see the below pie charts which display the most popular brand names that installers are selecting for their premium option. Note that the most used premium solar panel or inverter is not necessarily the best quality, it is simply an indicator of market share.
Four important factors that influence the solar panel costs in Australia:
1. Wholesale equipment costs
The wholesale cost of solar equipment has dropped significantly over the past 15 years as manufacturers have reach enormous economies of scale following the global growth of the industry.
The production of solar panels and inverters has mostly shifted to China and other Asian countries and are produced in Gigawatt scale, highly automated manufacturing facilities. The introduction of robotics and AI has also had an material effect on the quality and efficiency of the output of these facilities.
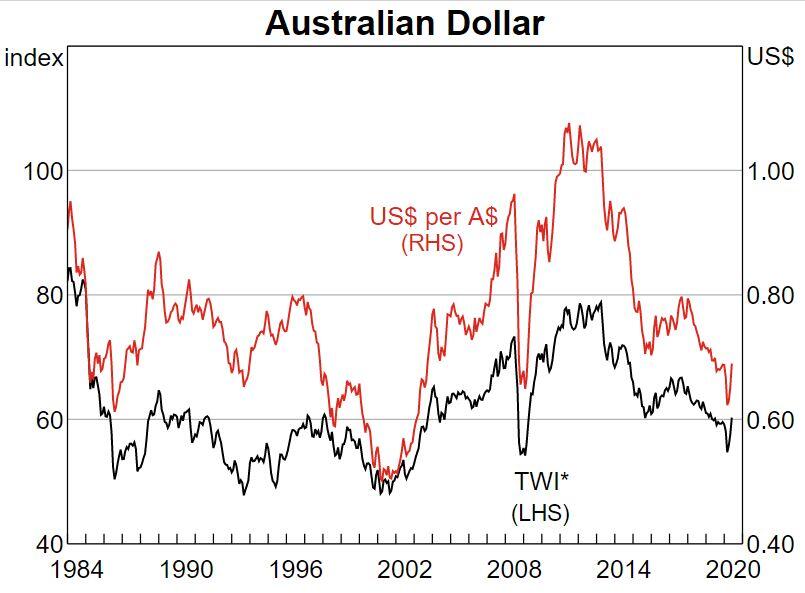
2. The Australian Dollar
Most components for a solar system come from overseas. As the relative price of the Australian Dollar changes, solar equipment manufacturers distributors rapidly change their prices to reflect this.
Most quotes for installing solar are only valid for 7 to 30 days so that solar installers are not forced to wear any underlying changes in cost. In general, an increase in the AUD/USD rate will lower the cost of a solar quote, and vice versa.
3. The Solar Rebates
The federal solar rebate – STC program – winds back each year until it is phased out completely in 2030. This provides upward pressure on solar pricing but has been overshadowed in the early solar years with the cost of solar decreasing.
Since 2021 we have not seen major decreases in the wholesale solar equipment costs and this decreased rebate value has led to the net cost of solar increasing slightly in recent years. This can be seen in the graph at the top of this article.
4. Competition and Cheap Solar Panels
The solar industry is one of Australia’s most competitive markets with over 6,000 contractors accredited by the Clean Energy Council to install solar. As a result, the margins have been forced to be very slim in the market.
Unfortunately, this has driven some installers to sacrifice the quality of products and services to offer ‘crazy prices’ and support them with broad-scale marketing efforts to drive high volumes. These tactics have provided downward pricing pressure, but in most cases have not improved the outcome for consumers.
What about solar panel costs in the future?
Many people in the solar industry expect solar panel costs to continue to decline, albeit at a much slower pace. Manufacturers continue to progressively release improvements in cell efficiency and panel designs which are now edging leading Solar Panels towards 1,000W of power.
However, a lot of the early step-change efficiencies of production have already been achieved in robotic-driven factories of enormous scale. Additionally in Australia, the STC rebate reduces each year until it is scheduled to phase out completely in 2030.
In the future, we expect the average cost of solar to increase each year for residential systems.
Compare quotes from up to 7 installers in your area now.
Commercial solar panel costs (Price Index)
Since May 2014, Solar Choice has been publishing commercial-scale solar PV system prices for each of Australia’s capital cities across a range of popular system sizes. Solar Choice manages tenders for a wide range of commercial solar projects around Australia. The figures in the tables below are based on data from our extensive network of solar installers, many of which specialize solely in commercial-scale solar projects.
Companies in our network upload their pricing & product information for us to present to our commercial clients in our free & impartial quote comparisons so that the client can make an informed decision about who to pursue further discussion with.
All prices in the tables below include incentives available through the federal Renewable Energy Target (i.e. STCs) as well as GST.
Request a free solar business case and compare leading commercial installers
Average commercial solar panel costs by city & size (May 2025)
10kW
30kW
50kW
70kW
100kW
Adelaide, SA
$8,800
$29,920
$56,770
$75,560
$91,710
Brisbane, QLD
$9,570
$26,780
$46,970
$66,290
$87,180
Canberra, ACT
$9,970
$38,960
$54,800
$70,220
$99,920
Hobart, TAS
$12,230
$26,810
$48,580
$66,380
$79,320
Melbourne, VIC
$9,330
$27,990
$49,260
$64,450
$85,770
Sydney, NSW
$8,820
$25,910
$46,400
$62,970
$82,880
Perth, WA
$11,200
$31,170
$57,170
$73,580
$89,890
All
$9,990
$29,650
$51,420
$68,490
$88,100
Average commercial solar panel costs per watt (May 2025)
Average
10kW
30kW
50kW
70kW
100kW
Adelaide, SA
$0.95
$0.78
$0.94
$1.06
$1.02
$0.92
Brisbane, QLD
$0.89
$0.91
$0.82
$0.93
$0.95
$0.87
Canberra, ACT
$1.07
$0.95
$1.30
$1.09
$1.00
$1.00
Hobart, TAS
$0.90
$1.07
$0.84
$0.92
$0.89
$0.75
Melbourne, VIC
$0.94
$0.91
$0.93
$0.98
$0.92
$0.86
Sydney, NSW
$0.85
$0.81
$0.83
$0.90
$0.87
$0.82
Perth, WA
$0.98
$0.98
$0.96
$1.05
$0.99
$0.87
Average
$0.97
$0.92
$0.95
$0.99
$0.95
$0.87
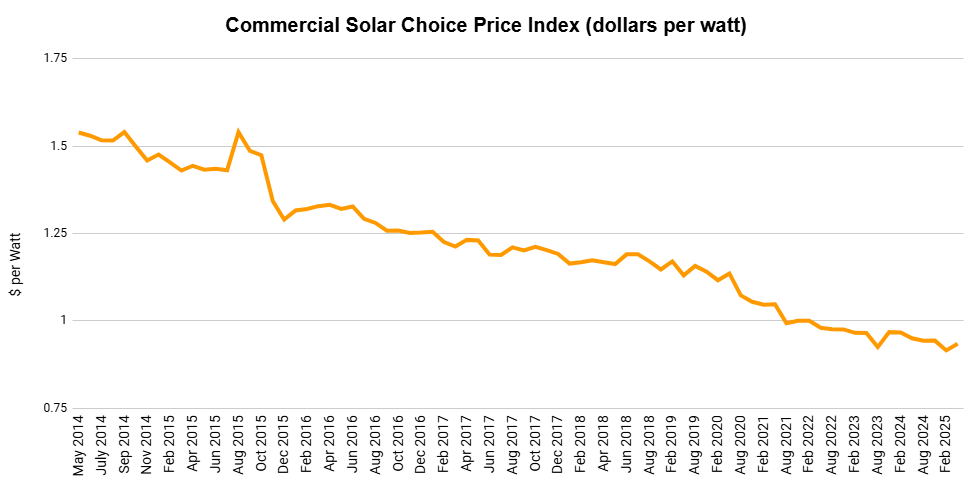
Historic average commercial solar panel costs (August 2012 – May 2025)
Jeff has consulted on over 20MW of commercial solar projects, ranging from SMEs to ASX top 100 companies. Jeff has also provided independent advice to 100s of residential solar, battery and EV charging customers across every state in Australia. He holds an MBA from the Australian Graduate School of Management and is an expert in business strategy and financial analysis.