The average price for installing a solar system at the beginning of May 2013 is down slightly from the previous month. System prices in Sydney, despite having risen slightly on average from April 2013, remain the lowest in Australia for all system sizes (1.5kW-5kW). Canberra and Perth continue to see gradual price reductions for all system sizes. Prices in Melbourne, Brisbane, and Adelaide have seen a reversal in the increases of the previous month, with price decreases of varying degrees in all 3 cities for all system sizes. Meanwhile, Hobart system prices have either remained steady or risen.
Average out-of-pocket cost for solar PV systems by size and city
The table below shows the average of the prices on offer for installed solar PV systems (after subsidy) of all sizes in Australia’s major cities at the beginning of May 2013. Sydney is home to the lowest average system prices in each system size category; Hobart is the highest.
| Solar Choice: Average Solar PV System Prices* – May 2013 | |||||
| 1.5kW | 2kW | 3kW | 4kW | 5kW | |
| Adelaide, SA | $3,736 | $4,684 | $6,057 | $7,852 | $9,342 |
| Brisbane, QLD | $3,672 | $4,656 | $6,190 | $7,989 | $9,398 |
| Canberra, ACT | $3,954 | $4,810 | $6,534 | $8,199 | $9,869 |
| Hobart, TAS | $4,412 | $5,558 | $6,839 | $9,321 | $10,632 |
| Melbourne, VIC | $3,959 | $4,738 | $6,531 | $8,295 | $9,441 |
| Sydney, NSW | $3,046 | $3,931 | $5,210 | $7,076 | $8,375 |
| Perth, WA | $3,230 | $4,043 | $5,586 | $7,431 | $8,681 |
| All | $3,715 | $4,631 | $6,135 | $8,023 | $9,391 |
$/watt solar system prices: Average, highs, lows
The table below contains dollar per watt ($/W) price data for 1.5kW, 2kW, 3kW, 4kW and 5kW solar PV systems in the 7 cities included in the PV Price Index (Darwin is not included at this point in time). Prices include the federal government’s small-scale technology certificate (STC) subsidy for solar power and other renewable energy sources.
For May 2013, STCs helped to decrease system prices in Zone 3 cities (Adelaide, Brisbane, Canberra, Sydney, and Perth) by on average 63c/W. In less sunny Zone 4 cities (Hobart, Melbourne), the contribution of STCs was approximately 53c/W, calculated based on the STC discounts explicitly detailed by installers, when available–i.e.when not omitted as part of a ‘package deal’. The rough ‘subsidy-free’ price of a solar PV system can therefore be calculated by adding this amount to the figures in the table below.
| Solar Choice: PV system prices, $/Watt – May 2013 | ||||||
| 1.5kW | 2kW | 3kW | 4kW | 5kW | ||
| Adelaide, SA | Average | $2.44 | $2.34 | $2.04 | $1.98 | $1.86 |
| High | $3.06 | $2.78 | $2.34 | $2.14 | $2.08 | |
| Low | $1.99 | $1.99 | $2.00 | $1.90 | $1.75 | |
| Brisbane, QLD | Average | $2.38 | $2.30 | $2.07 | $2.01 | $1.88 |
| High | $3.13 | $2.85 | $2.67 | $2.29 | $2.22 | |
| Low | $1.99 | $2.00 | $1.83 | $1.75 | $1.60 | |
| Canberra, ACT | Average | $2.57 | $2.40 | $2.13 | $2.06 | $1.94 |
| High | $3.78 | $3.23 | $2.84 | $2.53 | $2.47 | |
| Low | $1.87 | $1.80 | $1.90 | $1.75 | $1.60 | |
| Hobart, TAS | Average | $3.03 | $2.82 | $2.35 | $2.25 | $2.15 |
| High | $4.57 | $4.26 | $3.26 | $2.73 | $2.71 | |
| Low | $2.33 | $2.20 | $1.98 | $2.00 | $1.82 | |
| Melbourne, VIC | Average | $2.67 | $2.39 | $2.20 | $2.04 | $1.92 |
| High | $4.02 | $3.33 | $2.98 | $2.52 | $2.56 | |
| Low | $1.99 | $2.00 | $1.80 | $1.72 | $1.60 | |
| Sydney, NSW | Average | $2.00 | $1.97 | $1.73 | $1.77 | $1.68 |
| High | $2.47 | $2.25 | $1.99 | $2.12 | $1.98 | |
| Low | $1.41 | $1.73 | $1.42 | $1.54 | $1.49 | |
| Perth, WA | Average | $2.16 | $2.01 | $1.89 | $1.83 | $1.73 |
| High | $2.47 | $2.25 | $2.05 | $2.02 | $2.09 | |
| Low | $1.99 | $1.80 | $1.64 | $1.56 | $1.44 | |
| All | Average | $2.46 | $2.32 | $2.06 | $1.99 | $1.88 |
| High | $4.57 | $4.26 | $3.26 | $2.73 | $2.71 | |
| Low | $1.41 | $1.73 | $1.42 | $1.54 | $1.44 | |
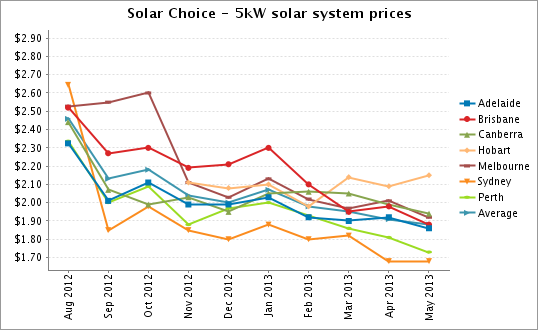
Solar PV system prices to date
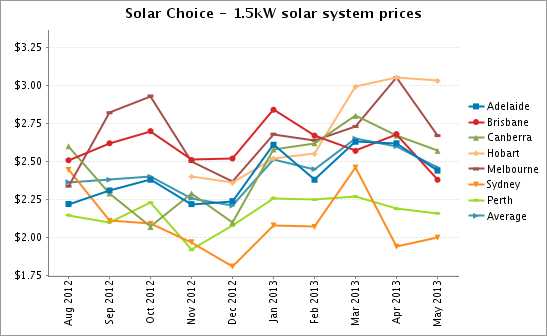
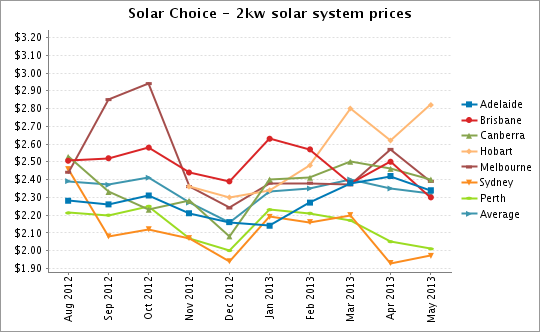
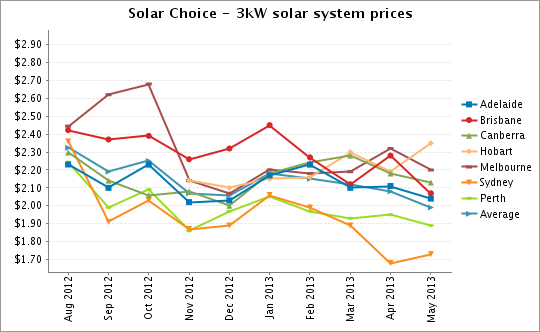
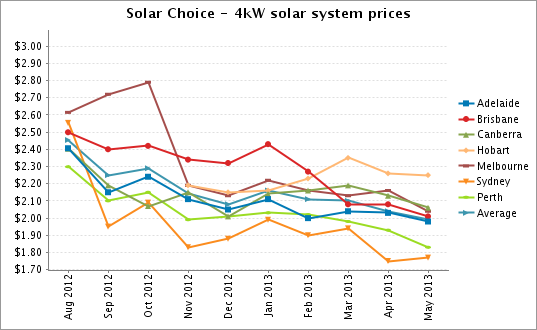
Solar Choice has been compiling solar PV price data since August 2012. The charts below show the monthly movements in (subsidised) system prices since then.
Although system system prices are anticipated to increase through 2013, a steady upward trend has not thus far been observable in the data from the Solar Choice installer database. With the exception 1.5kW systems, the average price for all system sizes is now either lower or about the same as what it was in August 2012. Prices did fall across the board at the end of the 2012 calendar year, and increases could thereafter distinctly visible for the first 1-3 months of 2013, but this trend seems to have levelled out over the past 2 months–especially for the larger system sizes (3kW, 5kW).
About this data
The figures and charts in this article were calculated using data from the Solar Choice installer network database, which contains current pricing and product details from over 125 solar installation companies across Australia. Prices do not include meter installation charges or extra charges for difficult installations. The discount available exclusively to Solar Choice customers (the Solar Choice Discount) is also excluded from the figures and calculations. Although a range of installer offerings from each city are included in the calculations, average price figures do not incorporate installers’ ‘premium’ offerings.
About Solar Choice
Solar Choice has enabled over 105,000 Australian households to make an informed choice about solar power. Working with over 125 of Australia’s top solar companies, Solar Choice is able to provide free and impartial Solar Quote Comparisons for customers across the country. Solar Choice’s commercial wing has managed the tenders for hundreds of large-scale solar PV projects throughout Australia for a variety of commercial clients, including BHP, Woolworth’s, and McDonald’s Restaurants Australia.
© 2013 Solar Choice Pty Ltd

He is now the communications manager for energy technology startup SwitchDin, but remains an occasional contributor to the Solar Choice blog.
James lives in Newcastle in a house with a weird solar system.
- Solar Hot Water System: Everything You Need to Know - 27 February, 2024
- Can I add more panels to my existing solar system? - 8 August, 2023
- Expanding an existing solar system with more panels and/or batteries? Know your options - 4 August, 2023