Grid electricity prices fluctuate over time – and usually they increase. This has important implications for anyone considering going solar. This article covers the basics of what you need to know about electricity price inflation to help you make a more well-informed decision about going solar.
Why do grid electricity prices increase?
The retail electricity prices you see on your bill are actually a combination of several different components, including:
- Wholesale electricity prices: What is the average cost of electricity generation on the National Electricity Market (NEM)?
- Transmission & distribution costs: How much does it cost to deliver energy from its point of generation to where it is used?
- ‘Green scheme’ costs: How much do incentives like state-sponsored solar feed-in tariffs and the federal Renewable Energy Target add to costs?
- Retailer costs: How much do their operational costs & profits add to electricity prices?
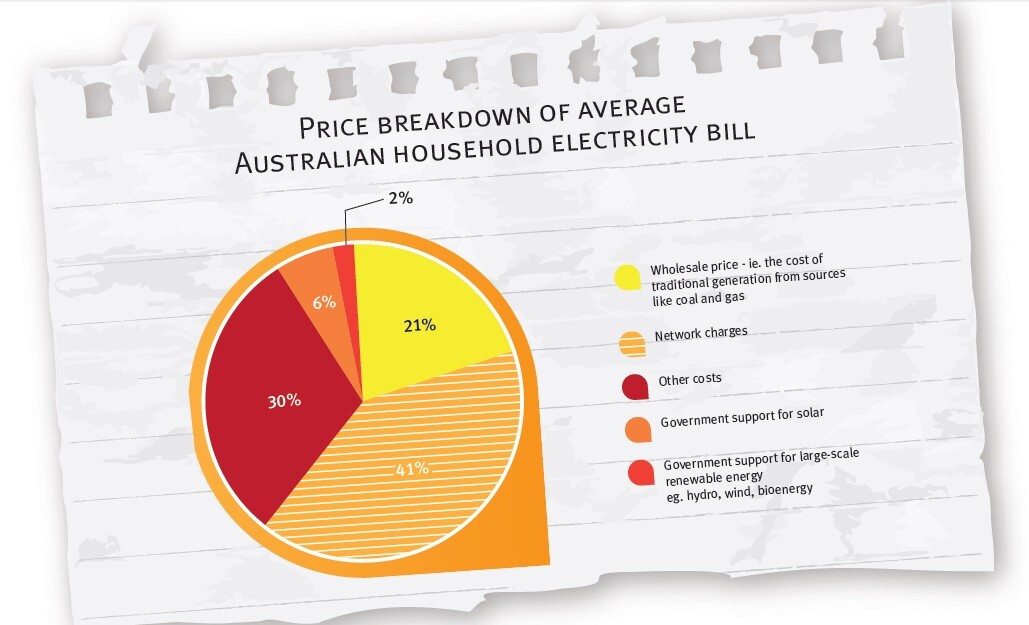
An example breakdown of electricity prices in Australia. (Image via Solar Citizens / Clean Energy Council.)
This means that electricity prices increase (or decrease) for a variety of reasons – and often a combination of two or more of the factors above. In recent years, network costs have been the main driver behind price increases (although they’re starting to come back down now), while wholesale prices have been on the rise since the beginning of 2016. While retail electricity prices may decrease some years, the long-term trend seems to be inexorably upwards.
The role of the retailer in setting energy prices
If you are a homeowner or business, any electricity price increases should be made known to you by your retailer in advance of receiving your energy bill. Retailers are the companies that ‘package’ the various pricing elements – ideally delivering stable, set prices to you by taking on certain risks themselves. The biggest risk is usually the wholesale cost of electricity generation – electricity spot prices fluctuate every five minutes (the basic interval for trading on the NEM). Spot prices are determined in real-time based on some combination of electricity demand volume, generation capacity available and fuel type composition (e.g. a mix of wind, coal and gas). Part of the premium that they put on your electricity usage charges has to do with the risk that they take.
While this risk-taking is (arguably) most important job of a retailer, that does not mean are reckless gamblers; on the contrary, they are always keen to find ways to reduce risk (and hopefully charge you less than other retailers). One of the primary ways that they do so is through futures contracts, through which they essentially make deals with generators about what the price of a megawatt-hour (MWh) of electricity will be in the coming years. This gives them them assurances that spot price volatility won’t affect their ability to do business or have a dire (but non-catastrophic) impact on their profits. It also enables them to plan their pricing for customers ahead of time.
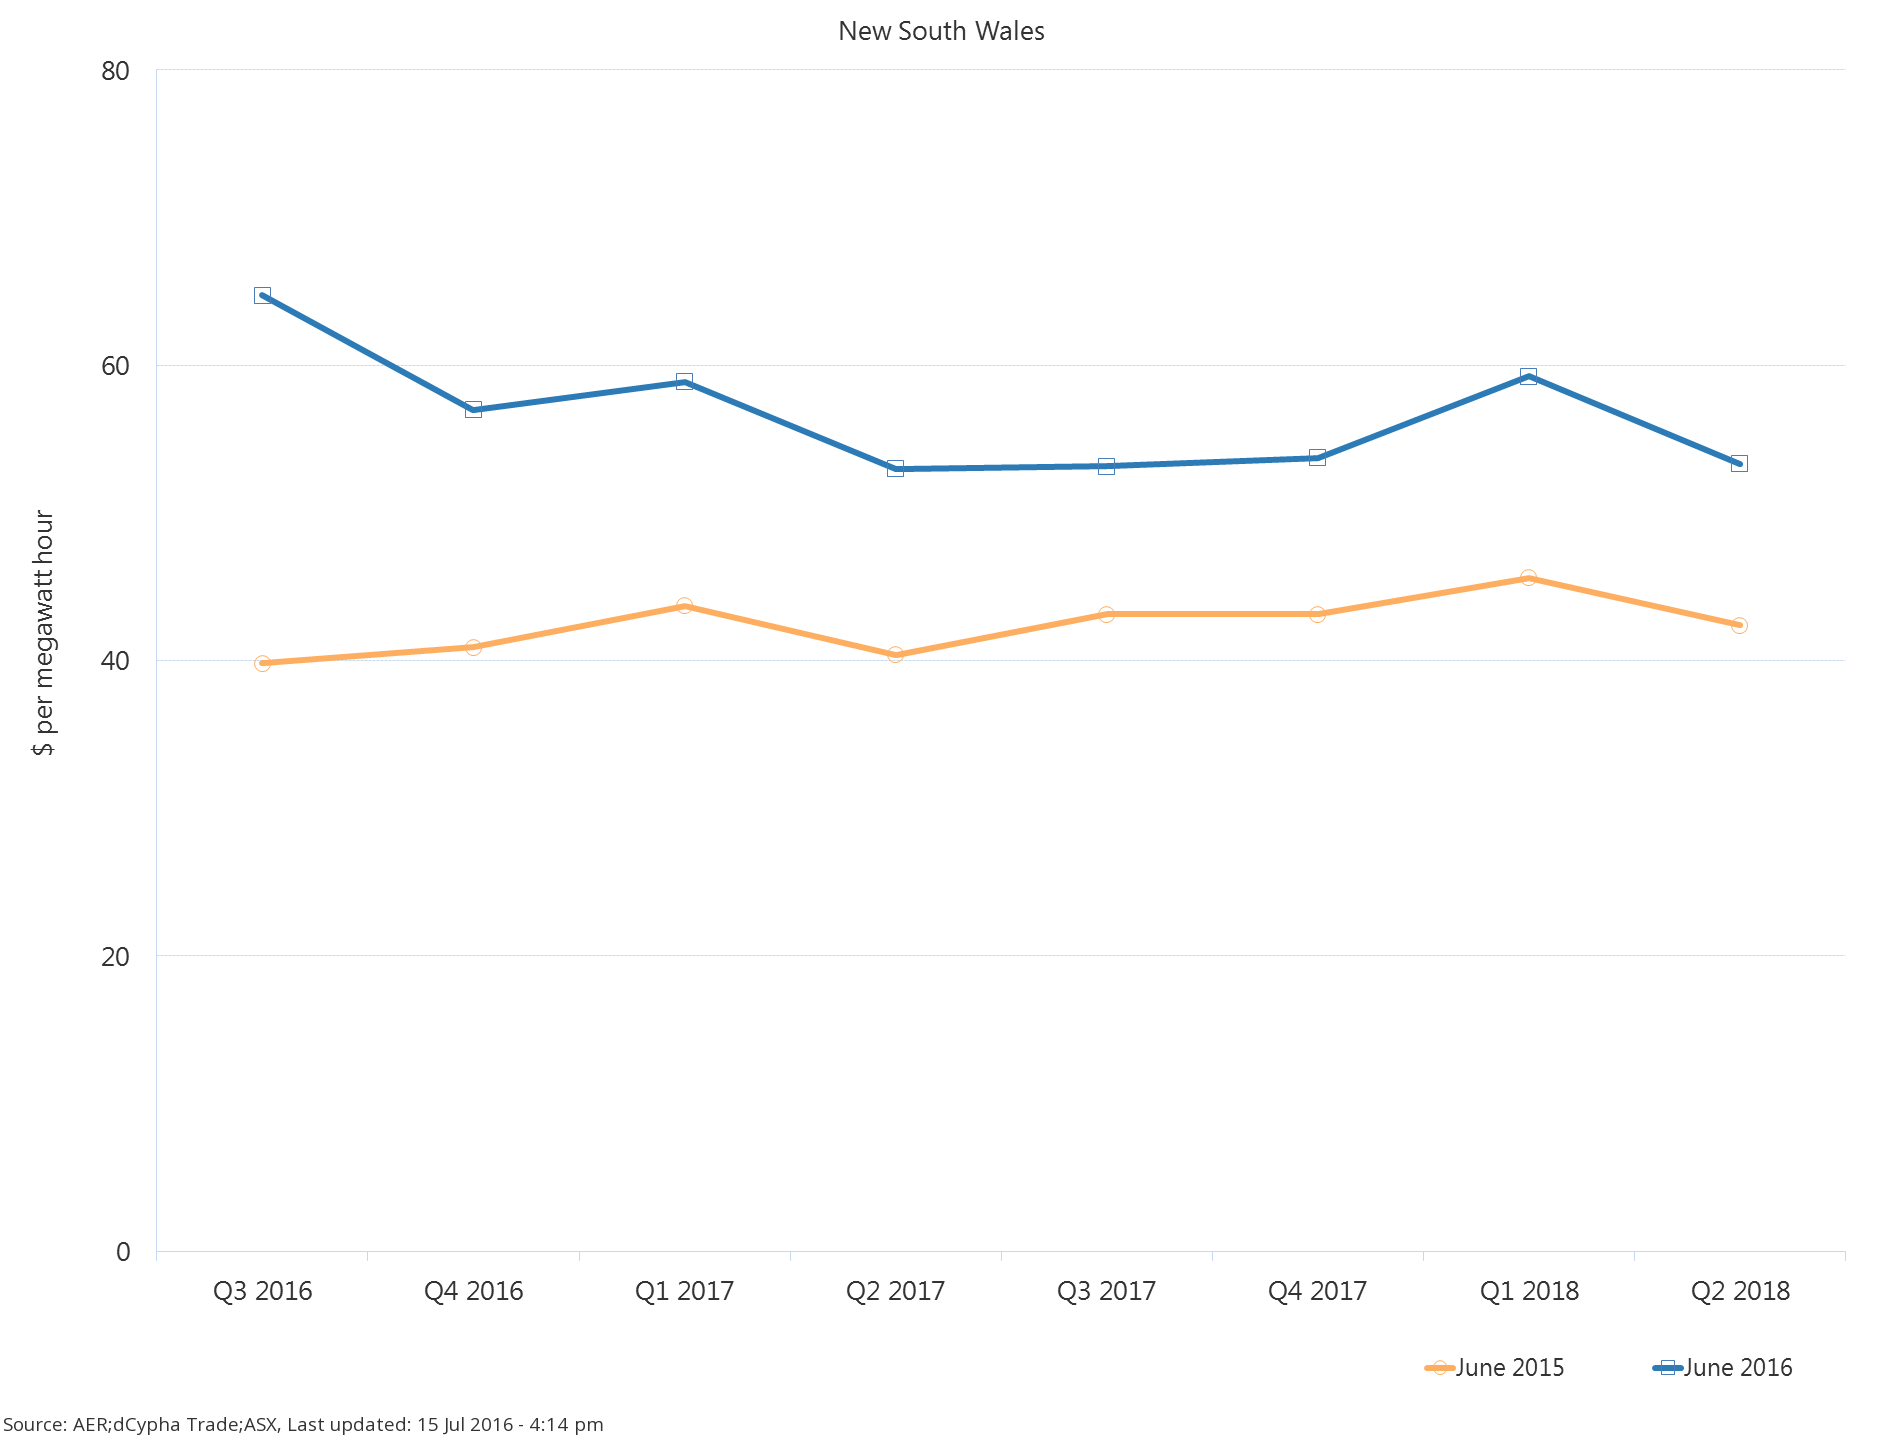
Base futures prices for wholesale electricity in NSW from June 2014 and 2015 (Via the Australian Energy Regulator.). This chart shows how retailers were anticipating wholesale electricity price increases well into the future.
The other cost components of retail electricity are generally more predictable than wholesale generation prices – network cost increases, for example, must be approved in advance by regulators and (generally) do not fluctuate wildly. Similarly, ‘green scheme’ costs are tied to pieces of legislation, making them by and large relatively predictable year-on-year (and while on the rise, they are still only a relatively small component of pricing at about 6% in 2015).
The table below shows how actual average wholesale prices have fluctuated year-on-year in NSW in the last 12 years. As you can see, it’s pretty wild – and doesn’t look anything like the futures contract price trajectories in the table above.
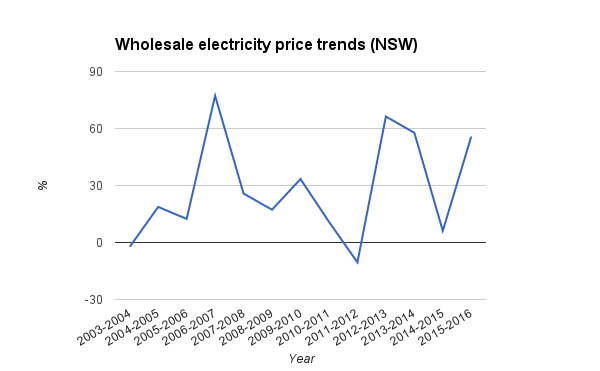
Wholesale electricity price trends between 2003 and 2015 for NSW (data via AEMO). Average annual prices have fluctuated significantly from year to year, but the overall trend has been upwards, with 2015-2016 prices nearly 60% higher than 2003-2004 levels. Keep in mind that the wholesale price is only one piece of the larger pricing puzzle – a 2015 report from the Australian Energy Market Commission (AEMC) notes that rising wholesale costs have been in part offset by falling network costs.
Accordingly, average retail electricity prices in NSW increased by over 50% between 2006 and 2014 – not exactly aligned with wholesale market, where prices actually decreased by about 40% between those years (although the longer-term trend is still upwards).
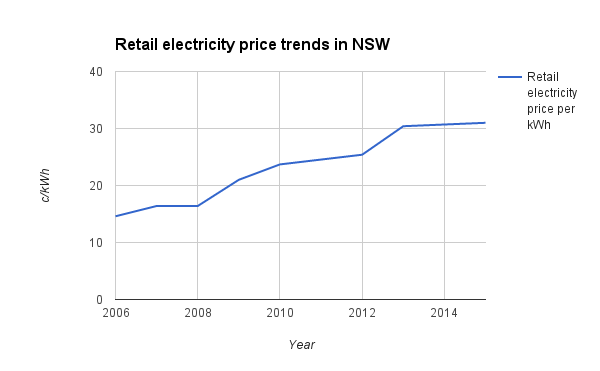
Average retail electricity prices for NSW homes between 2006 and 2014 (data via AEMC). There has been a 50% increase across the period – or about 6% per year.
What does electricity price inflation have to do with solar?
The energy bill that you get from your retailer is likely comprised of to components: A daily, fixed ‘supply charge’, plus ‘usage’ charges – the amount that you pay per unit (kilowatt-hour or kWh) of electricity from the grid. Depending on your billing arrangement, your electricity rate may vary throughout the day (see our article about time of use billing), or it may be a flat, c/kWh rate. Some plans even have billing ‘tiers’ – where rates may increase or decrease as you consume a greater amount of energy during a day or quarter. The long and short of it is this: If you consume fewer units of energy from the grid, your usage charges will decrease, while you will be billed for supply charges no matter what you do (unless you go off-grid). Wholesale electricity prices are the prime determinant of how usage charges will change.
By and large, Australians install solar panels with the intention of saving money. Going solar helps you to reduce the usage portion of your bill – by generating your own energy, you don’t need to purchase as much from the grid. By going solar, a home or business also reduces their exposure to the price increases which usage rates can be subject to – you have a much better idea about what you can expect to pay (or not pay) for your energy.
Electricity price inflation and solar system purchase
Most Australians who go solar purchase their systems outright or with financing, and will start saving money on their power bills from day 1. Thanks to low solar installation prices, system payback times can be as short as 2-3 years in the right circumstances, and an levelised cost of roughly 4-8c/kWh over the system’s lifetime (depending on how much you pay for the system and how much sunshine your roof gets). If a system is large enough and the energy used appropriately (or if battery storage is installed), it may even be possible to reduce your energy usage charges to $0 (although you’ll still pay supply charges). Also keep in mind that you’ll be responsible for basic maintenance costs (such as replacing your system’s inverter 7-10 years after the system is installed.)
The table below gives a simplified example of electricity prices from the grid vs electricity prices from a solar system on a $/kWh basis (assuming a conservative 3% average annual inflation rate). In reality, grid energy rates could fluctuate from year to year – sometimes going lower, sometimes going higher, but the graph nonetheless illustrates the point that rooftop solar panels can insulate a home or business against inflation.
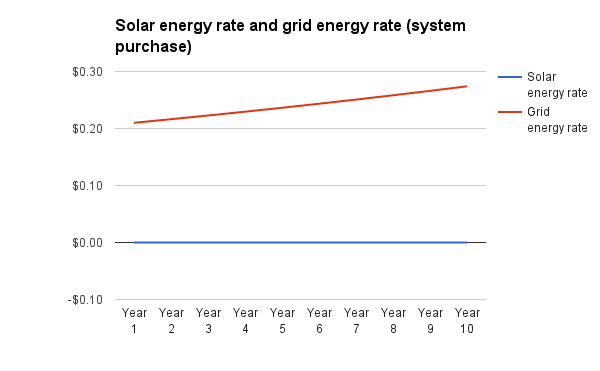
A simplified example of how grid electricity rates increase over time (assuming 3% electricity price inflation per year) vs solar energy cost after purchase. Once your system is up and running, the energy it produces is ‘free’. (Keeping in mind that you will be responsible for routine maintenance – such as inverter replacements).
Electricity price inflation and solar PPAs
Electricity price inflation is particularly important for those who are considering going solar with a power purchase agreement (PPA). PPAs – a cousin of a solar lease – is an arrangement in which a solar system is installed on your roof and you purchase the energy from it on a per-unit (c/kWh) basis. You do not own the system – you simply benefit from the energy it produces, which should be sold to you at a rate lower than what you pay for electricity from the grid. This allows you the dual benefit of conserving capital (you do not have to pay anything for the system to be installed) and – ideally – benefiting from reduced energy bills from day 1. In Australia, solar PPAs are particularly attractive for businesses, which are able to benefit from all of the solar energy produced directly during the daylight hours. (They are less appealing to homes, due mainly to the fact that the occupants are likely to be out during the day.)
As with purchase, the basic value proposition of a solar PPA is that it promises to save you money on your power bills. However, because you don’t own the system, the energy it produces is never ‘free’ for you to use. In most instances, PPAs will start at an agreed-upon rate for the solar energy which is lower than the retail electricity rate. This solar rate can be fixed for the entire PPA contract term (never increasing), but in most cases it increases in accordance with a ‘solar escalator’. The escalator rate will be determined by the financier of the PPA, but will generally be based on (or compared to) either the consumer price index (CPI) or electricity inflation rates (e.g. future contract rate increases).
CPI rates are quite general, and are unlikely to accurately correspond to pricing movements in the energy sector, so if you’re in the market for a PPA it makes more sense to look at long-term electricity inflation rates (e.g. 10 years if your PPA is for 10 years, or 20 years for a 20-year PPA, etc). By doing so, you’ll be in a good position to negotiate an escalator rate that you’re comfortable with. Ideally, your PPA will come in at a rate low enough to ensure that your solar energy is always less expensive than grid electricity every year – even in years when retail electricity prices might be lower than the previous year (which can sometimes happen).
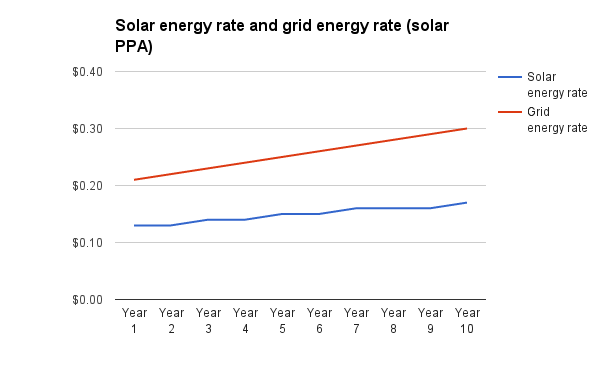
A simplified example of how grid electricity rates increase over time (assuming 4% electricity price inflation per year) vs how solar PPA rates might increase (assuming a solar escalator of 2.5% annually). As you can see, solar rates stay well below the grid rates. While the real-life retail rates may fluctuate, they would have to drop very low to be more cost-effective than the solar PPA rates in this scenario.
Some tips for looking at ‘solar escalator’ rates on PPAs
- Find out what the long-term, year-on-year electricity inflation rates are in your state (e.g. in NSW it’s roughly 6% over the past 8 years). Make sure that the rates in your PPA quote are on the conservative side (i.e. lower than the actual inflation rates). This will help you hedge against the possibility that future inflation rates are lower than expected.
- Aim for as low a solar escalator as possible – one that is lower than the anticipated inflation rate. This will help you to ensure that your solar rates are always significantly lower than your grid electricity rates.
- You may also be able to negotiate a solar escalator that changes year on year in relation to futures contract fluctuations, which would help you to ensure that your solar rates always stay under inflation rates. However, a fluctuating escalator would probably be more complicated and onerous than a rate set at the beginning of the contract term.
Compare solar & battery storage quotes from installers in your area. (And quotes for financing & PPA options as well!)
© 2016 Solar Choice Pty Ltd

- The Top 5 Problems With Cheap Air Conditioning Quotes - 12 January, 2026
- Running Cost of Air Conditioners – Explained - 7 October, 2025
- Air Conditioner Rebate South Australia: What You Need to Know - 19 September, 2025