Having just published an article on the state of Australia’s battery storage market at the beginning of 2018 (recently updated), we decided we would endeavour to shed a bit more light on payback period differences between each capital city. Which cities have the best conditions for home solar battery storage? We’ve ranked them below (with an explanation of our process & assumptions at the bottom of this article).
Please note that this article looks at ‘brand new’ solar + storage systems as a single package with a single price tag. In fact, payback periods for solar systems on their own (without batteries) are generally still much shorter than solar + battery systems in Australia (see here), mainly due to the price of battery storage (see analysis the financials of battery retrofits in this article).
That being said, putting money into battery storage is starting to look more appealing as prices continue to fall and grid electricity prices continue to rise. For Australian households looking to take energy matters into their own hands and insulate themselves against grid electricity price increases, battery storage could be worth it.
As we continue to receive substantial interest in battery storage systems from our customers & website visitors, we have put together this ranking of capital cities based on their attractiveness as a place to install a solar & battery system.
Overview: All results in one chart
The chart below displays the main results of our analysis (i.e. system payback period by city, product & tariff type) in one place, while the following tables examine the viability of storage on a city-by-city basis.
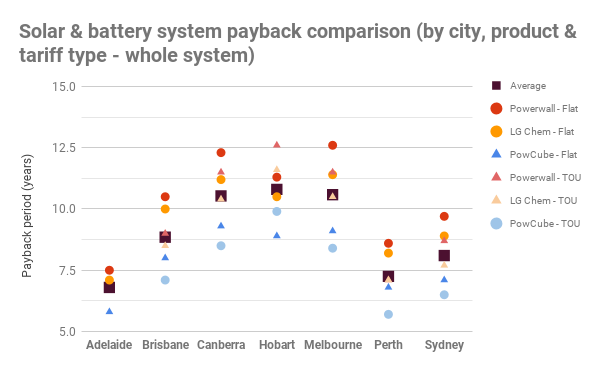
Table above: Battery storage payback periods by battery system size, city and tariff type. (Looking at solar + batteries as a single package.)
This article was originally published in February 2017. It was last updated on 24 Jan 108 to take into account changing grid electricity prices, solar feed-in tariff rates, battery installation prices and solar PV system installation prices.
Compare solar & battery storage quotes from installers in your area!
Compare Solar & Battery Quotes
1. Adelaide – Average payback period of 6.8 years
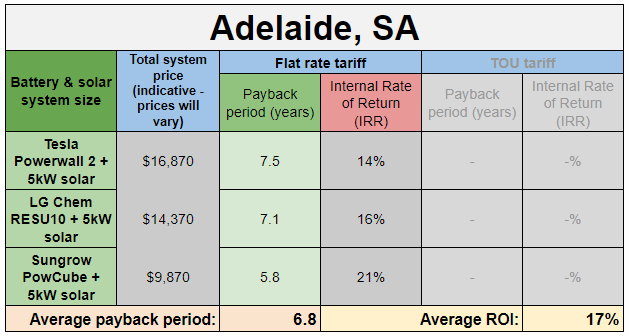
- Flat rate tariff details: 34c/kWh
- TOU tariff details: Not examined (only 1 company’s offers available on EnergyMadeEasy)
- Assumed feed-in tariff rate: 11c/kWh
There are a number of reasons why battery storage is a compelling option in South Australia’s capital, despite two things that at first glance would appear to disadvantage the city:
- The most stringent (*ahem* – draconian?) grid connection rules in Australia which limit total solar & battery inverter capacity to 5kW per phase (thanks, SAPN) – which means in effect that you can only install a Tesla Powerwall 2 (which has its own, inbuilt 5kW inverter) alongside a 5kW solar system if you’re on dual phase or 3-phase power; and
- The absence of a range of competitive time of use (TOU) tariff options – TOU tariffs tend to be the best tariff type for battery system owners, financially speaking. Instead, the lowest flat (‘peak only’) tariff rates available tend to be as high as the TOU peak rates in other capital cities.
But two other circumstances in Adelaide more than offset the impact of these two factors. Namely:
- Adelaide (and SA generally) has the highest electricity prices in Australia (and among the highest in the world), which means households are quite keen to purchase as little possible from the grid as possible; and
- Fear of blackouts has people looking for affordable emergency backup options.
On top of this, there are a couple of other items that help to sweeten the battery pie in the city:
- Volatile wholesale spot market prices mean that battery system owners are increasingly likely to have opportunities to sell their stored energy at a premium (‘selective export‘) to help shore up the grid (this is a
- The City of Adelaide has a generous battery incentive scheme available to people living within the downtown postcode areas. (Note that we haven’t accounted for this incentive in our analysis.)
2. Perth – Average payback period of 7.4 years
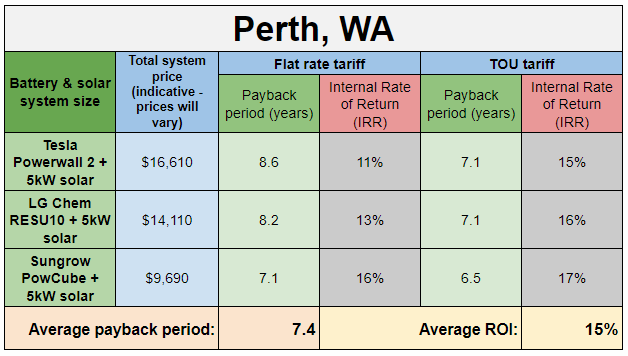
- Flat rate tariff details: 27c/kWh
- TOU tariff details: Peak – 50c/kWh, Shoulder – 26c/kWh, Off-peak – 14c/kWh
- Assumed feed-in tariff rate: 7c/kWh
High electricity prices contrasted against a low feed-in tariff rate make Perth prime territory for battery storage. Households on a time of use tariff (‘Synergy Smart Home Plan‘) are likely see better returns and shorter payback periods (as short as 6.5 years) for their systems than those on Synergy’s flat rate.
3. Sydney – Average payback period of 8.1 years
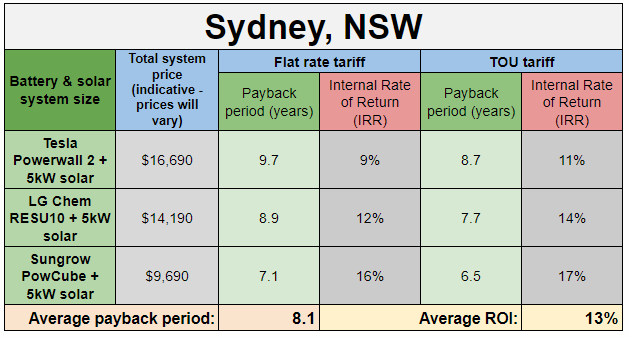
- Flat / block rate tariff details: 25c/kWh
- TOU tariff details: Peak – 47c/kWh, Shoulder – 18c/kWh, Off-peak – 12c/kWh
- Assumed feed-in tariff rate: 11c/kWh
With payback periods hovering around 8 years on average (or about 7.6 for households on a time of use tariff) and an average IRR of 13%, Sydney comes in as the #3 best city to install solar & batteries, according to our analysis.
4. Brisbane – Average payback period of 8.9 years
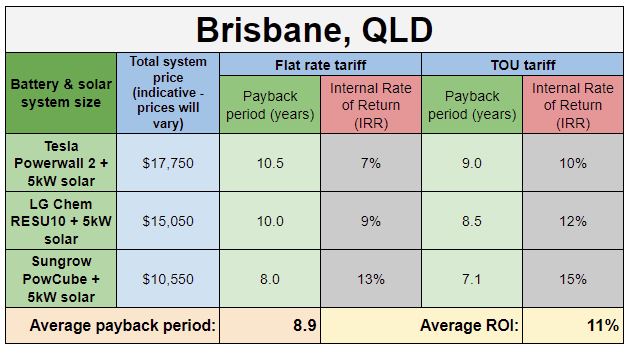
- Flat rate tariff details: 21c/kWh
- TOU tariff details: Peak – 33c/kWh, Shoulder – 23c/kWh, Off-peak – 18c/kWh
- Assumed feed-in tariff rate: 11c/kWh
The sunniest of all the capitals we’ve examined here (we left out Darwin – see #8 below), battery storage remains moderately attractive in Brisbane despite middling electricity prices (only 21c/kWh as opposed to 25c/kWh in Sydney or 34c/kWh in Perth, for example). A smaller battery bank on a time of use tariff will deliver the best results.
5. Canberra – Average payback period of 10.5 years
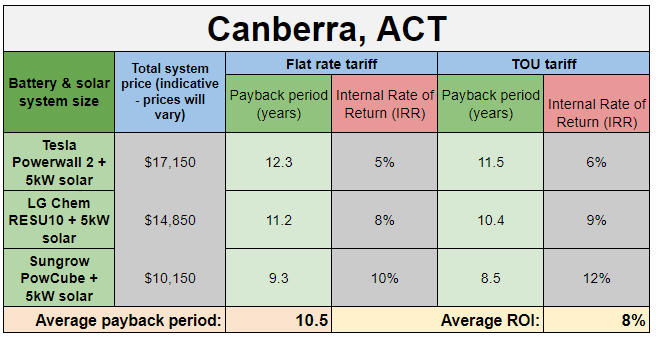
- Flat rate tariff details: 19c/kWh
- TOU tariff details: Peak – 25c/kWh, Shoulder – 18c/kWh, Off-peak – 14c/kWh
- Assumed feed-in tariff rate: 8c/kWh
With an average payback period of just over 10 years (due largely to the relatively low electricity prices in the Territory), Canberra may not at first glance seem like a fantastic place for solar & batteries, but bear in mind that we have not incorporated the ACT’s NextGen battery storage incentive into our calculations. If you live in the Australian capital, make sure you do your research into how this incentive works and how to take advantage of it.
Furthermore, comparatively low feed-in rates (only about 8c/kWh) set the stage for greater uptake of batteries in the future if battery prices continue to fall. As with the other cities discussed so far in this list (besides Adelaide), households who install batteries will be better off under a time of use teriff.
6. Hobart – Average payback period of 10.8 years
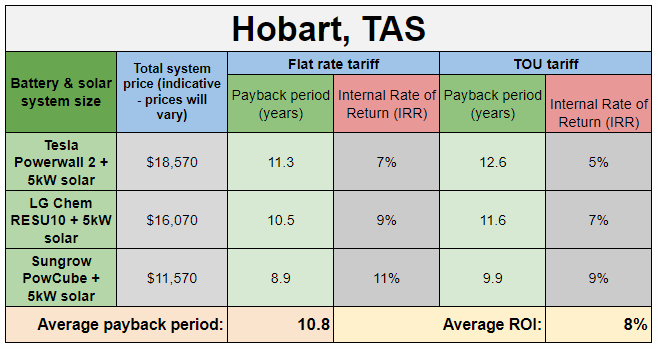
- Flat rate tariff details: 26c/kWh
- TOU tariff details: Peak – 31c, Off-peak – 15c
- Assumed feed-in tariff rate: 9c/kWh
Hobart is a surprise entry at the #6 slot, thanks to modestly high electricity prices and a low feed-in rate and despite the fact that it is the nation’s least sunny capital city. While a 10.8 year payback period is nearly a year more than the standard battery product warranty of 10 years, it seems entirely possible for Hobart residents to do better than this by shopping around, choosing the right battery product at the right price.
Interestingly – and in stark contrast to all the other cities on this list – our analysis shows better returns and shorter payback periods for customers on the flat rate tariff. We note, however, that we’ve been contacted by one Tasmanian retailer/installer who advises that TOU may frequently be the better option for most households, depending on their individual circumstances (we’ve only modelled one consumption scenario in this analysis).
All of this is not to mention the Tasmanian government’s TEELS ‘green loan’ program, which offers interest-free financing for up to 36 months for a range of ‘eligible products’, including solar panels & battery storage.
7. Melbourne – Average payback period of 10.6 years*
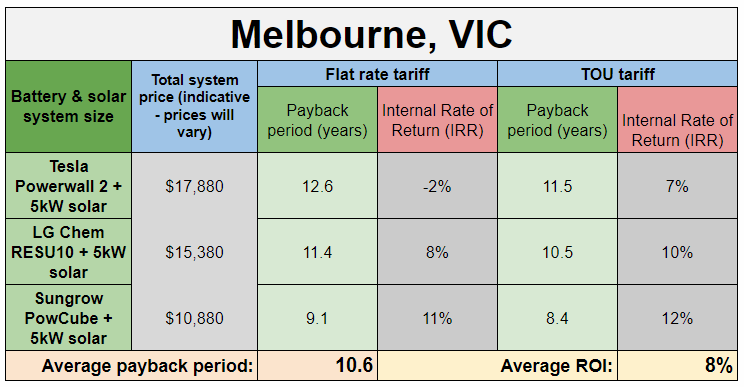
- Flat rate tariff details: 21c/kWh
- TOU tariff details: Peak – 24c, Off-peak – 16c
- Assumed feed-in tariff rate: 11.3c/kWh
Low electricity prices and a mandatory minimum solar feed-in tariff of 11.3c/kWh (which applies to all of Victoria) makes Melbourne one of the least attractive capital cities for batteries (from a financial point of view) than any of the other capital cities (besides Darwin – see #8 below). Electricity prices are set to increase in the state, however, and while this is not by any means good news for anyone who pays a power bill, it does lift the appeal of solar & battery storage systems there.
That being said, the lowest payback period we see in the mix is still a respectable 8.4 years – which is less than the standard battery warranty period of 10 years. It’s certainly feasible that Melbournites could do better than this by choosing the right products at the right price.
We also remind readers that Melbourne remains a great place to get solar (without batteries) at the moment thanks to the high feed-in rate (see our article: Is solar power still worth it in Australia in 2018?)
Meanwhile, for households focused on energy independence (or who just want to see as small an electricity bill as possible for the next 10 years), batteries will continue to hold their gleaming appeal regardless of how they perform as an investment.
*After originally publishing this article, we received feedback (see comments section below) that our electricity rates for Melbourne were too low, as we had used a post code from the urban, high-density CitiPower network area instead of a more realistic example from one of Melbourne’s low-rise suburban areas. We have since updated the example pricing used in our modelling and update the results here and in this piece’s sister article. Although the average payback period for Melbourne now comes in as slightly shorter than Hobart (see #6), we’ve decided to leave Melbourne in the #7 spot because of the mandatory feed-in tariff rate in the Victoria. which (as noted above) reduces the financial attractiveness of batteries. Also please note that Melbourne is the only capital city divided into several different electricity networks; retail electricity plan offers available may differ depending on which network services your home. A list of current rates on offer by network can be found on the Wattever website.
8. Darwin – Don’t get batteries (unless you want to go off-grid) – but definitely look into solar
- Flat rate tariff details: 26c/kWh
- TOU tariff details: Peak – 30c/kWh, Off-peak -23c/kWh
- Assumed feed-in tariff rate: Equal to retail tariffs (Assuming 26c/kWh for flat-rate customers, 30c/kWh for TOU customers. Note that under TOU customers are actually paid the off-peak rate between 6pm and 6am, but due to limitations in PVSell we have only used the peak rate.)
Despite the fact that Darwin is Australia’s sunniest capital – and the only one located in the tropics – the incentives for solar system owners in the state mean that batteries do not make any financial sense at all. (Unless you’re looking at an off-grid system – which is beyond the scope of this article.)
Here’s why: In every capital city besides Darwin, sending solar into the grid will net a solar system owner only about 8c/kWh (approx). This is significantly lower than the rate that customers pay for electricity from the grid; someone with a solar system would save more money by using the solar energy directly (‘solar self-consumption‘), thereby reducing their electricity bill by avoiding the purchase of expensive grid electricity (about 25c/kWh in most places).
But most solar system owners cannot use all of their solar energy during the daylight hours, and inevitably have ‘excess’ energy. Batteries allow them to ‘save’ their solar energy for use later in the day, when they’re more likely to use it (e.g. around dinner time, after the sun has gone down). By doing so, they save about 17c/kWh (the difference between the feed-in rate and their retail rate).
The smaller the difference between the feed-in tariff rate and the consumption rate, the less value that batteries offer. For Darwin customers, there is no difference between the feed-in rate and the consumption rate. This means that there is virtually zero opportunity to save money by installing batteries. Furthermore, because batteries are not 100% efficient, it’s almost inevitable that you will lose money for every kWh of solar energy that you ‘shift’ for later use via your batteries.
Key takeaway: All in all, in Darwin the payback period will be longer for a solar + battery system than it will for a solar only system – even if you spend the same amount of money (e.g. $18,800) on the system. Until the feed-in tariff rate drops, batteries will make no sense for Darwin customers – but in the meantime solar makes great sense!
Important caveats about these results
The payback period and returns for a given solar + battery storage system will depend on the exact circumstances of the home in question. The conclusions we’ve drawn here (using our Solar & Battery Storage Sizing & Payback Estimator) are based on only a handful of scenarios and are meant to act as a bellwether for the viability of battery storage in Australia’s capital cities. Also keep in mind that we’ve also left out incentives available in Adelaide, the ACT and parts of WA – which could make a big difference in reducing payback times and increasing the attractiveness of a battery storage investment.
Solar Choice has a number of free, handy tools that allow you to delve into the details a bit more yourself, including our Solar & Battery Storage System Sizing & Payback Estimator. The results from this and other tools we offer will allow you to roughly work out what size system would best work for your home – putting you in a good position to assess quotes and initiate a discussion with installers.
Remember – in the end, a system that is customised for your home & habits will deliver the best value and greatest possible savings. When looking at the results below, keep this fact in mind and see if you can find better outcomes for yourself!
Assumptions used
| Scenario assumptions | |
| Energy consumption: | 25kWh/day |
| Energy usage pattern: | ‘Evening peak’ (out during the day) on weekdays, and ‘Day focus’ on weekends |
| Solar system prices: | Average for each capital city as of January 2018 (see table below) |
| Battery system installation prices: | Same for each city (see this article for more details). Battery systems were chosen for their size (small, medium, large), relative affordability & similar performance specs. Actual prices will vary with installer & location. |
| Electricity rates: | Best rates available for each city (as found on EnergyMadeEasy.gov.au and other relevant sites – checked & updated in Jan 2018). We assume a blanket 3% annual price inflation rate for all cities, as well as a 5% financial discount rate in all scenarios. |
| Solar feed-in rates: | We also checked EnergyMadeEasy.gov.au for solar feed-in rates in each city (rates checked & updated in Jan 2018). |
| Battery charging type: | Solar charging only (no charging with grid) |
| Battery discharge settings: | Discharge whenever needed (i.e. benefits of tariff arbitrage on TOU tariffs not accounted for in calculations) |
| Battery degradation: | Not accounted for in calculations |
| Battery incentives (ACT, Adelaide, WA): | Not accounted for in calculations |
| Purchase type: | Results are all based on the assumption that the systems are purchased with cash (no financing), with both solar & battery components of the system being purchased at the same time (no battery retrofits) |
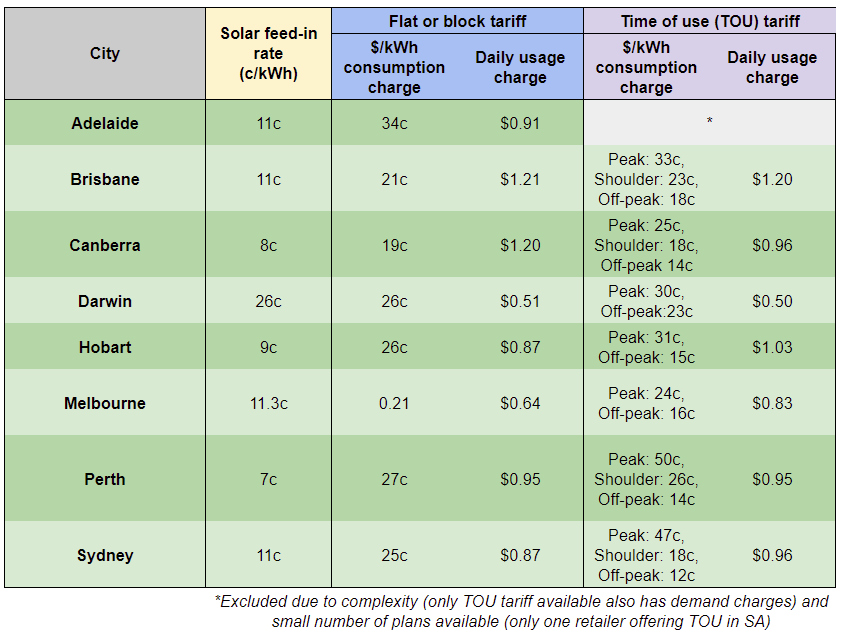
Electricity tariff details by city (flat & time of use tariffs):
Detailed results by battery product:
Tesla Powerwall 2
LG Chem RESU10
Sungrow PowCube
Check out these useful resources:
Compare solar & battery storage quotes for your area
Compare Solar & Battery Quotes
Learn more about battery storage: Check out our Battery Storage 101 page
Try our Solar & Battery Storage Sizing & Payback Estimator Tool or our Battery Retrofit Sizing Estimator Tool
Check out our Battery Storage Product Performance Comparison Tool
© 2018 Solar Choice Pty Ltd

He is now the communications manager for energy technology startup SwitchDin, but remains an occasional contributor to the Solar Choice blog.
James lives in Newcastle in a house with a weird solar system.
- Solar Power Wagga Wagga, NSW – Compare outputs, returns and installers - 13 March, 2025
- Monocrystalline vs Polycrystalline Solar Panels: Busting Myths - 11 November, 2024
- Solar Hot Water System: Everything You Need to Know - 27 February, 2024
Hi Solar Choice,
Firstly, love your work! You guys do a fantastic job.
Just a small suggestion on this analysis. It would be better to do it by distributor than by city, at least in VIC. The Melbourne result reflects the the tariffs in the Citipower area which is a very small part of the Melbourne which is predominately high / mid-rise at not great for solar. The bulk of the city is powered by Jemena, United Energy, Ausnet and Powercor. Re running the results in the Powercor area will give you a completely different result. We believe it’s comparable with the returns you’ll find in Adelaide.
Cheers,
James
Thanks, James. We will look into updating the analysis ASAP.
Hi James,
I’ve just updated the article using the slightly higher rates on offer in the Jemena network instead of the Citipower region. I’ve also made some notes about Melbourne and the fact that there are different networks. The re-analysis does yield slightly better results for Melbourne (e.g. shorter payback periods), but by no means brings the city close to Adelaide in terms of battery attractiveness. Happy to hear your thoughts on this, but I don’t think I’m likely to see anything anytime soon that will change my mind!
For anyone who is interested, a complete list of electricity rates (continually updated) is available here on the the Wattever website. I’ve had it confirmed for me that all the rates in the tables there are inclusive of discounts (e.g. pay on time, pay online) and GST.