NSW demand rose to a near-record high on Friday the 10th of February, and QLD soared to a new record demand on that Sunday, amidst an intense heatwave. While this heat-stressed our electricity markets and infrastructure, the nation’s rooftop solar PV systems were providing critical load reduction under plentiful sunshine. A quick review of APVI data from 10 February shows that in Queensland an estimated 5.5% of the mid-day demand was met by small-scale solar (at peak solar production), falling with the setting sun to around 1.5-2% during the 5-6PM(AEDT) peak demand period.
Even at a low proportion of total energy generation, this contribution was very important. According to APVI ~400MW of generation from small-scale PV was present at 5PM (AEDT), with ~200MW at 6PM. This contribution proved to be particularly important during the period where AEMO was forecasting a 310MW shortfall in generation; shortly before load shedding commenced just after 6PM (AEDT).
But even with the great intel from the APVI Live Solar PV map, the market was still left guessing about the near term reliability of that small-scale solar resource. Simply put, there are no forecasts of the near future power output that update based on real cloud and PV output data. Turning our attention instead to AEMO’s forecasting products, we can find some forecasting support for rooftop solar is provided by the ASEFS2 model, which was implemented by German wind energy consultant Overspeed and updates a few times per day. This model can be quite useful – in certain situations. Sunny days are straightforward. Even slow moving synoptic weather events can be well forecast by this product. But it has a significant Achilles’ heel…
I’m talking about clouds. Fast moving and fast-changing ones in particular. Cloud cover affects our electricity markets all of the time, yet such impacts are not well understood, nor are they well predicted by the forecasting solutions currently available to our energy market.
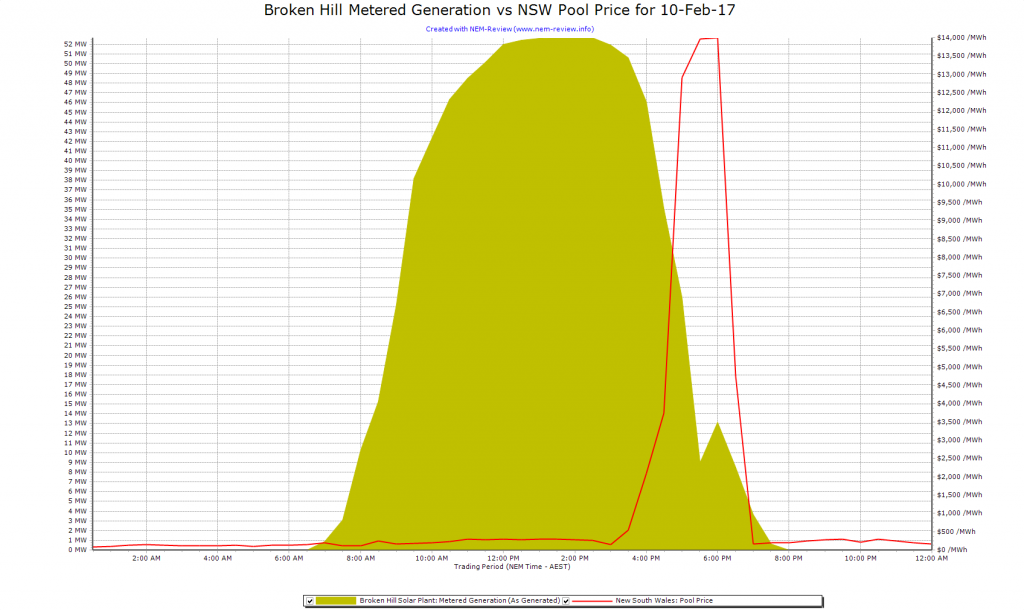
So why is this important? Look no further than the cloud cover impacting the Broken Hill solar farm during the critical 5-6PM (AEDT) period. With 53MW of solar installed in 1 location; singular cloud features have the power to ramp up and down over very short time windows. And it did just that, with power output suddenly falling about 30MW around 5PM local time. At present, without active cloud tracking and forecasting, this type of situation is (seemingly) unpredictable.
One can easily extend this circumstance to introduce fast moving clouds over the concentrated small-scale solar resources in Sydney and the NSW coast, and the state’s total solar resource could have fallen further by a few hundreds of MW inside 30 minutes. Under the forecasting resources currently available to the market, this would happen seemingly without warning. The cost and impacts of such an event would have been quite noticeable.
This type of sudden change in solar PV power output isn’t limited to NSW, and isn’t driven only by one type of cloud cover situation. Fast changes in collective rooftop solar power output happen frequently (checkout my publication on this topic) and they have real impacts on supply-demand balance across the NEM. Worse, our current solutions (e.g. ASEFS2) can’t help us.
This was part of the motivation for the founding of Solcast, a new solar forecasting company partnered with The Australian National University. Solcast have recently launched a new solar forecasting service, which actively predicts the nation’s solar resource using satellite and PV data, updating every ten minutes. Solcast applies machine learning and computer vision techniques to forecast the future position of Australia’s cloud cover. With the location and thickness of the cloud cover in hand, Solcast applies radiation modelling techniques to estimate the types and amounts of radiation available at the Earth’s surface. This allows us to continually update the forecasting product, tracking any new developments in cloud cover features.
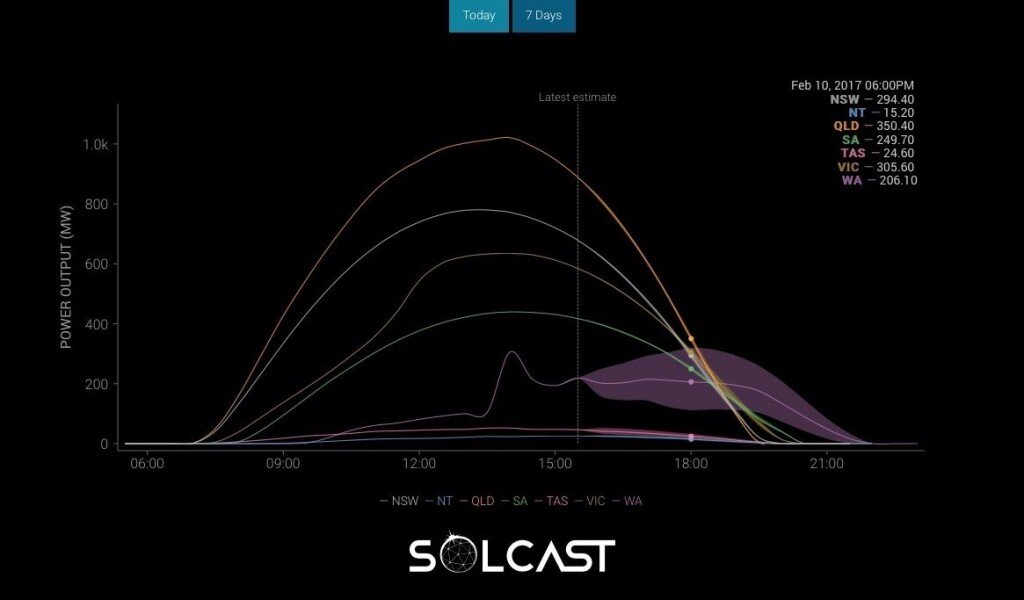
Using this technology, we thought it might be interesting to look once again at last Friday in NSW. Throughout the day, Solcast’s tech was tracking the extensive cloud band across southern Australia, which began to bite into Victorian solar supply by mid-day. These cloud features are the type of upper-level cloud formations that reduce solar power supply by 10-20%, but do little to immediately relieve the extreme heat in urban settings.
By 3PM (AEDT), Solcast’s updated forecasts were converging across the ensembles, producing highly confident NSW small-scale solar forecasts for the 4-6PM period, during a time where load-shedding was looking imminent and the energy market increasingly constrained:
Solcast was also producing forecasts for solar farms. Looking back at Broken Hill, we find a few very interesting things. First, we correctly forecast that there would be a large drop in power output at the farm. Shown below is our estimated actual from the farm, produced through use of satellite observation from a particular time-step, along with our 4:30PM (AEDT) issued forecast (blue).
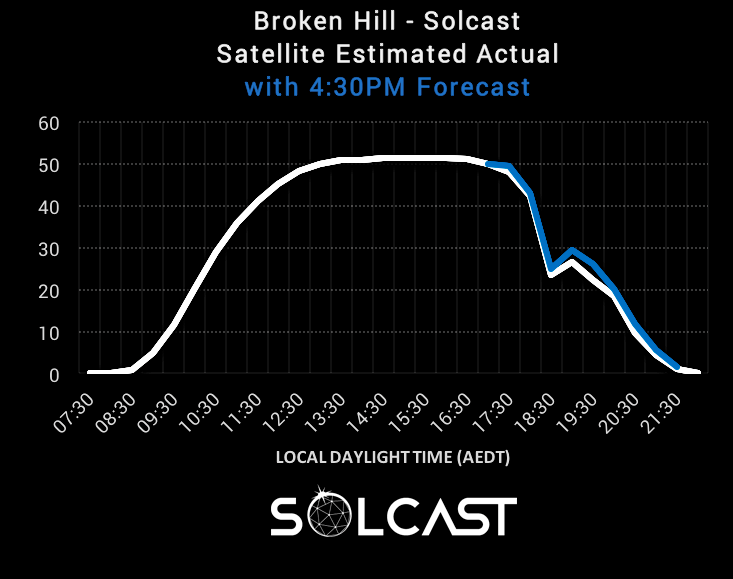
Digging in a bit deeper, we can even find the origins of this drop in power production by reviewing our cloud opacity estimates. Convective cloud cover was present, with fast-moving, fast-changing clouds reducing the power output of the farm quickly, before clearing and ramping it back up again. In the image above, we see 30 minute averages (to match the market), but in the image below we see where the 10 minute sampling rate of the satellite becomes incredibly useful, as we capture and forecast the rapidly evolving cloud features.
This critical period from 10 February is precisely the type of situation that Solcast is aiming to help with. With such high penetrations of small-scale solar present across Australia and several new large solar farms in the pipeline, Solcast believes that this type of technology will be important for maintaining predictability and stability in our power system.
Solcast has a live demo of their state-level small-scale forecast services online now, which is a feature in their new API product.
This article originally appeared on the WattClarity blog. Republished with permission.

in the field of solar radiation modelling and forecasting, and has co-founded Solcast out of a desire to enable others to build the solar-powered future.
- PV Performance Checker - 6 March, 2019
- The important role of solar forecasting in Australia - 22 February, 2017