Solar Choice has recently been in contact with Leighton Cochran, PhD of Brisbane-based MEL Consultants. Dr Cochran has conducted extensive research into wind loading for all types of solar technologies – from roof and ground-mounted solar PV modules to various concentrating solar technologies such as compact linear Fresnel reflectors (CLFR). His academic paper ‘On Wind Load Reduction: Solar Arrays in the Field and Building Roofs‘, has been replicated below in full with his permission. It can also be downloaded in PDF form here.
Dr Cochran can be reached via phone on (+61) 0481-263-324, or via email at cochran@melconsultants.com.
ABSTRACT: The goal of this short discussion paper is to provide some historical guidance to the considerable research that has been done in numerous boundary-layer wind tunnels in Australia, North America and Europe over the last forty years to better understand the wind loads on various solar-energy collection devices on buildings and in the open field. The large number of geometric parameters (shape, stationary tilt angle, one axis tracking, two axis tracking, row spacing, porous perimeter fences, porous internal fences, approach roughness, parapets, roof appurtenances, roof edge distance, aerodynamic devices, etc.) means that many permutations are incomplete. However, some understanding of what has happened to date may avoid some duplicated effort.
1 Introduction
Since the late 1970s many of the large wind-engineering research and consulting facilities have explored wind loads for flat-plate photovoltaic arrays, Fresnel concentrator photovoltaic arrays, thermal troughs, reflective heliostats, and parabolic dish collectors (radial and linear) in their boundary- layer wind tunnels. Many of the early studies focused on large fields of these solar elements, but in more recent times the work has been directed at architectural applications. The goal has typically been to understand, and then reduce, the design wind loads via various aerodynamic appurtenances such as solid or porous perimeter fences, module staggering, and edge separation control. Techniques used to measure the net forces or pressures on the various shapes at small scale in the boundary-layer wind tunnel have been either simultaneous pressure transducer systems or the high-frequency balance.
As the cost of the various energy generating systems have reduced in the last forty years the proportional cost of the footings and structural system supporting the solar technologies has increased. The traditional method a structural engineer uses to obtain design wind loads for any structure is the local wind code or standard. However, even in 2015, none of the major wind standards (AS/ NZS1170.2, ASCE7-10, Eurocode) give much useful advice for the shapes common in the solar industry, whether as a lone structure or part of a field of identical arrays. That said, there have been some stand-alone efforts published by interested professional societies. One of the most impressive recently is the 2012 SEAOC publication called “Wind Design for Low-Profile Solar Photovoltaic Arrays on Flat Roofs” [1]. Additional wind-tunnel studies, in parallel and following on from the SEAOC effort, by the wind-engineering team at TNO (Netherlands Organisation for Applied Scientific Research) expanded the code-orientated knowledge base by including the impact of deflectors for mid-latitude flat-plate systems in the new NEN-7250 document [2, 3]. Future wind-load standards will be inserting distilled research (e.g., the 2012 Amendment #2 to the AS/NZS1170.2 and the SEAOC document [1] for the new ASCE7-16) from the last few decades and providing conservative wind loads for select flat-plate geometries. However, for many geometries recourse to the wind tunnel is still the preferred methodology, if a better understanding of wind loading is desired for improved fixing and/or ballast design.
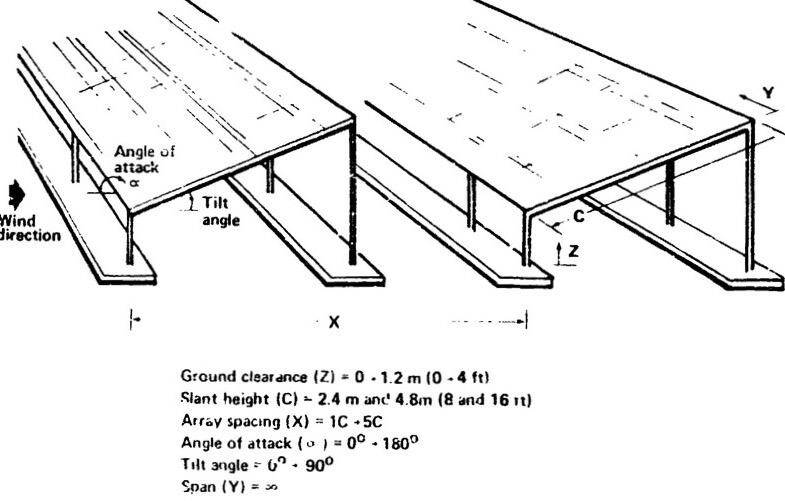 Figure 1: In 1979 the study by Miller and Zimmerman [4] had the basic sets of parameters of spacing, tilt angle, wind azimuth and ground clearance with no end effects considered (i.e. infinite row length)
The 2012 Amendment #2 to the Australian Standard is very specific to small sloped-roof commercial or domestic installations and only pertains to flat plate systems parallel to a sloped roof and close to that surface (50 to 300 mm). This amendment is quite similar in intent to the 2010 Florida Solar Energy Center document by Barkaszi and O’Brien [5]. A selection from many wind-tunnel studies will be discussed here; ranging from concentrator PV arrays in the 1980s, through trough studies in the 1990s, to recent (2014) rooftop studies for small tilt-angle PV designs destined for equatorial latitudes. Technical advances in performing these studies in the boundary-layer wind tunnel have made this type custom work more common in the last ten years, as technologies like multi-pressure systems, multi-axis balances, and stereolithographic model construction have substantially reduced research costs.
2 Early Wind Tunnel Studies
In the late 1970s and early 1980s the US Department of Energy sponsored a series of wind-tunnel studies to parameterize the key features (Figure 1) of simple flat plate designs for solar farms in an open-country wind environment. Even these early studies explored the need to reduce the wind loads via mechanisms like perimeter fences, corner devices to interfere with the corner vortex formation on the fences, and porous devices for the ends of the long rows of PVs (Figure 2).
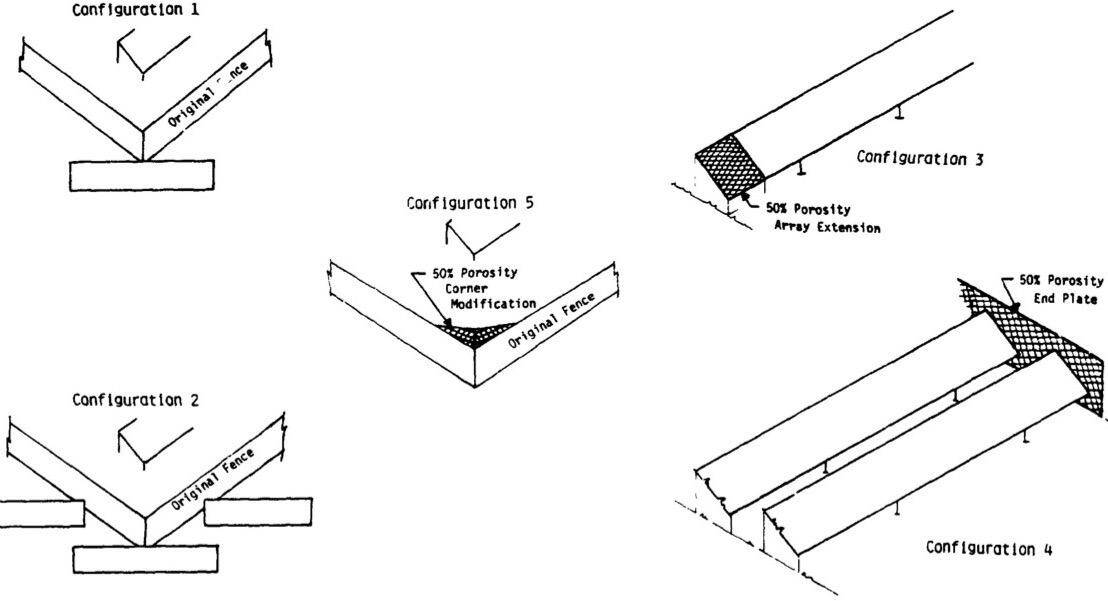 Figure 2: In 1981 the follow-on study by Miller and Zimmerman [6] even explored load reduction using porous fences and end details as well as methods to prevent vortex formation at the perimeter fence corners.
The technique of simultaneous differential pressure measurements in the wind tunnel was used to obtain the net peak uplift and downforce wind pressures at point locations on the arrays for key wind azimuths and over several rows of the arrays (Figure 3). By exploring perimeter fences and the wind loads on the front modules, edge modules, and mid-field modules a good understanding of the variation in peak pressures and impact of ambient turbulence was obtained. At this time the influence of tributary area and pressure correlation along the array row was not considered. However, over the next couple of decades the techniques of area-averaging and temporal pressure correlation were used to understand peak design pressures on PV arrays over several modules along the array. Even in 1998 the topic of how temporal correlation impacts peak pressures over various areas was a topic of full-scale and wind-tunnel experimentation (Figure 4).
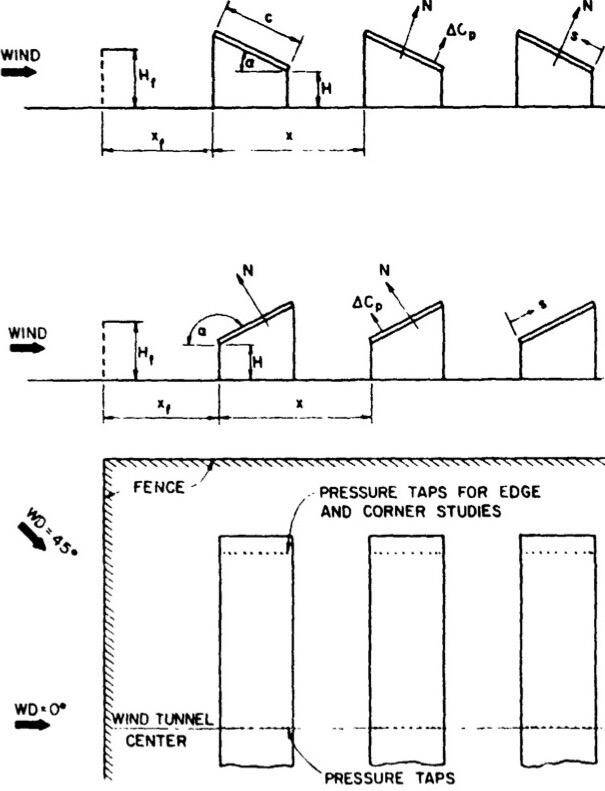 Figure 3: In 1981 the follow-on study by Millerand Zimmerman [6] investigated perimeter fences and the higher differential pressures at the end of the array row.
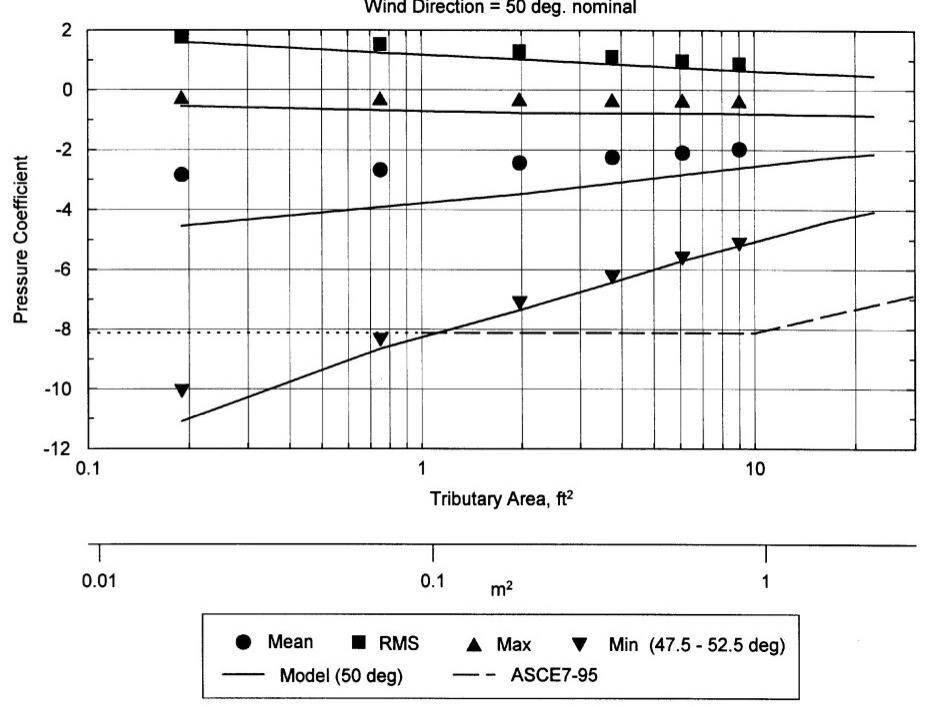 Figure 4: The relationship between tributary areas and peak pressure taken to small areas more associated shingles and other small roof components (after Peterka et al. [7]).
From a wind load codification perspective for building design this type of work yielded the well-known relationship between design peak pressures and the tributary area associated with those peak pressures. Examples of this may be seen in Table 5.4 of AS/NZS1170.2 or Figure 30.4 in ASCE7-10. This relationship between tributary area and resulting peak design pressure is one reason that code design pressures for, say, a free-standing carport cannot be used for the much smaller free-standing PV module, or similar. This is a common error made by structural engineers desperate to get code guidance on wind loads for flat-plate PVs.
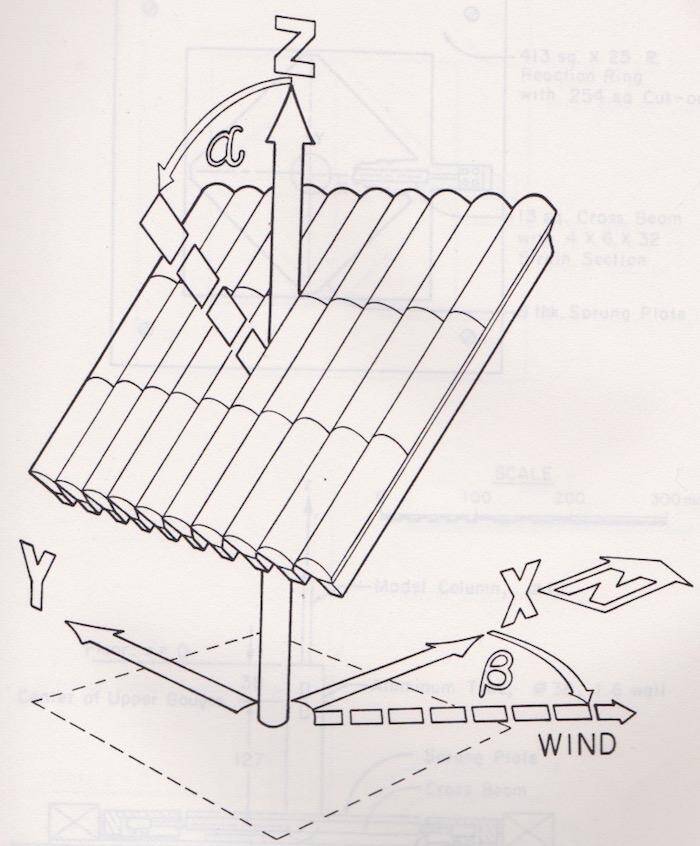 Figure 5: The coordinate scheme and nomenclature for the 30-module Fresnel concentrator PV design with no stagger or porosity. The drag and lift could be reduced by staggering modules out of plane (after [8]).
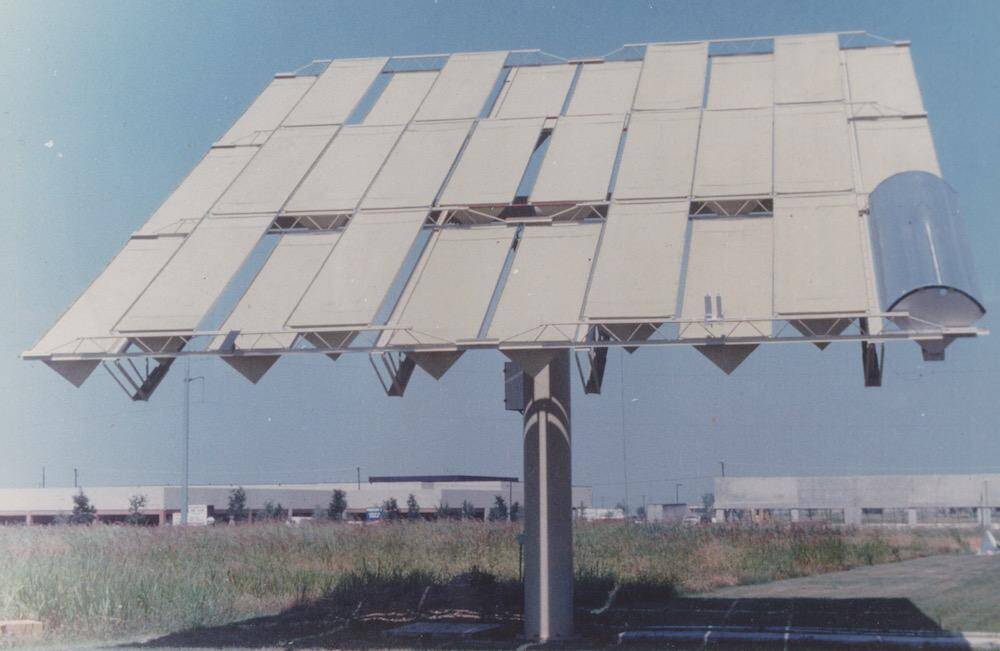 Figure 6: Assembly of the full-scale array with the motorized dual axis tracking system. One Fresnel concentrator PV module is installed.
By 1985 newer technologies were appearing with quite different geometries. One was the cylindrical, Fresnel [9], concentrator PV (about 20 suns concentration) module used to make an array of up to 30 modules on a single column support with dual axis tracking (Figures 5 and 6). Three variations of these Fresnel arrays were explored using 1:40 physical models mounted on a six-component high-frequency balance in the boundary-layer wind tunnel at The Engineering Research Center, located at Colorado State University. The work was done for Sandia National Laboratories. Since the collector surface was always perpendicular to the solar insolation the idea of staggering the modules out of plane was explored (Cochran [8]). The use of porosity created by staggering modules in the out-of-plane direction, producing an air path through the array, had the effect of reducing the mean drag and lift by up to 20%. Figure 6 shows a full-scale example being assembled in New Mexico. A key design parameter was the centre pivot moment that the motor system needed to overcome during peak wind loads; both during normal daily operation and during the transition to the “stow” position as a storm approaches.
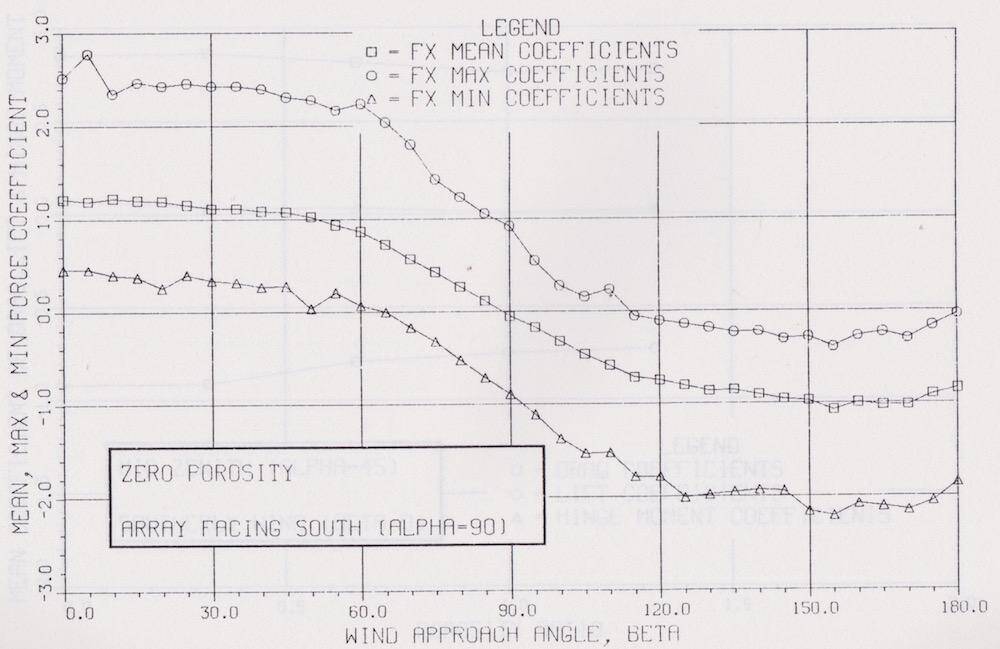 Figure 7: Mean and peak drag coefficient results with no porosity (after [8])
Large amounts of data were collected over a range of title angles, wind azimuths, array shapes, and porosities. Figure 7 is an example of the mean and peak drag coefficient data for a vertical orientation (α = 90o) of the non-staggered design (Figure 5). It is interesting to note the asymmetry of the drag data when the wind approaches from the front (curved surfaces) compared to the rear (sharp edged) of this vertical array case. The curved surfaces of the Fresnel partial cylinders result in a wider separated volume downwind than when the flow approaches the rear; yielding a larger net drag when the curved surface is on the windward side. This curved surface also had a notable impact on the lift results; as one might expect.
Fifteen years later Kopp et al. [10] at the University of Western Ontario investigated the same concentrator PV design as Cochran [8] at a much larger scale (1:6) in a pressure study that had the goal of understanding the torque loads caused by cascading turbulence on each of the more-separated modules. The dynamic torsional response of this group of modules can be key when they are motorized to provide a single axis rotation to track the sun across the sky. This use of the Fresnel PV design was intended to be roof mounted, rather than the field situation of Figure 6. At a scale of 1:6 several hundred pressure taps could be used to better understand the pressure distribution over this shape. Figure 8 shows one such pressure distribution which is quite asymmetric, yielding a net torque for the tracking system to accommodate.
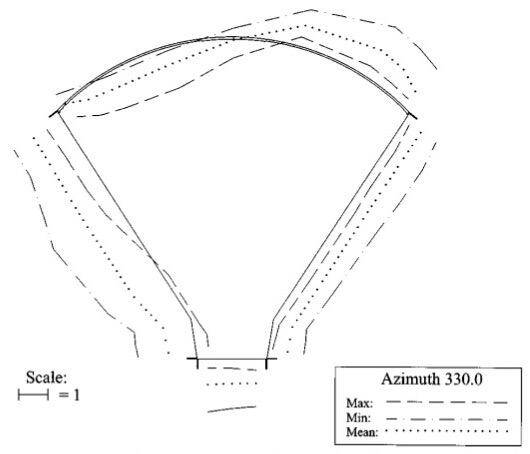 Figure 8: Mean and peak pressure coefficient results on the surface of a 1:6 model of the Fresnel concentrator PV module (after [10]).
3 Heliostats
A large series of studies were performed in the 1990s to derive peak wind loads on many ground-based mirrored heliostats in an open country environment. The intent was to focus solar energy onto a central elevated tower. Figure 9 shows the dual axis layout with a coordinate system for the motor or hinge location and another set of axes at ground level for the footings. Obviously the data generated from these studies of “many flat plates on poles” has successfully been applied to the planar, dual-axis tracking PV arrays on central poles that have become popular in recent years.
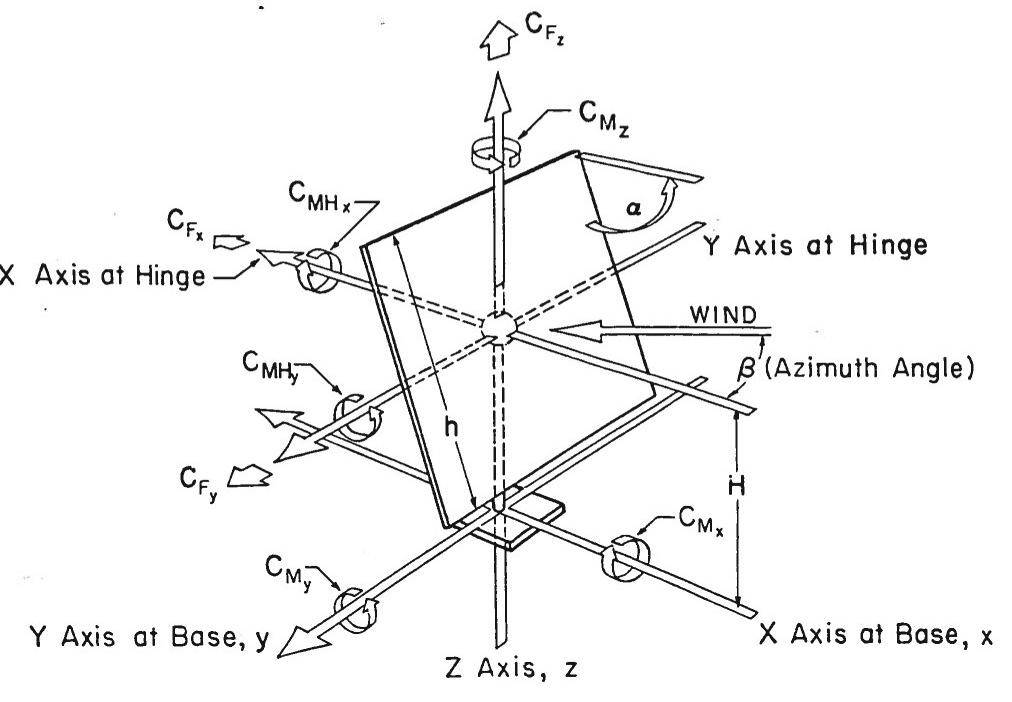 Figure 9: Coordinate scheme definitions for a typical heliostat study (after [11])
Due to the aerodynamic shielding caused by many independent arrays making up a large field facility a technique was developed to define the range of peak moments (say) in the field compared to a solo array with no shielding. The concept of a Generalized Blockage Area (GBA) was developed by the team at Colorado State University for Sandia National Laboratories [11, 12, 13]. In essence the GBA is the ratio of the projected solid upwind blockage area relative to wind direction to the ground area occupied by the blockage objects. By plotting the load ratio (peak action in the field divided by the same peak action for a lone heliostat) against GBA some design guidance, in the form of an envelope, could be developed (see Figure 10).
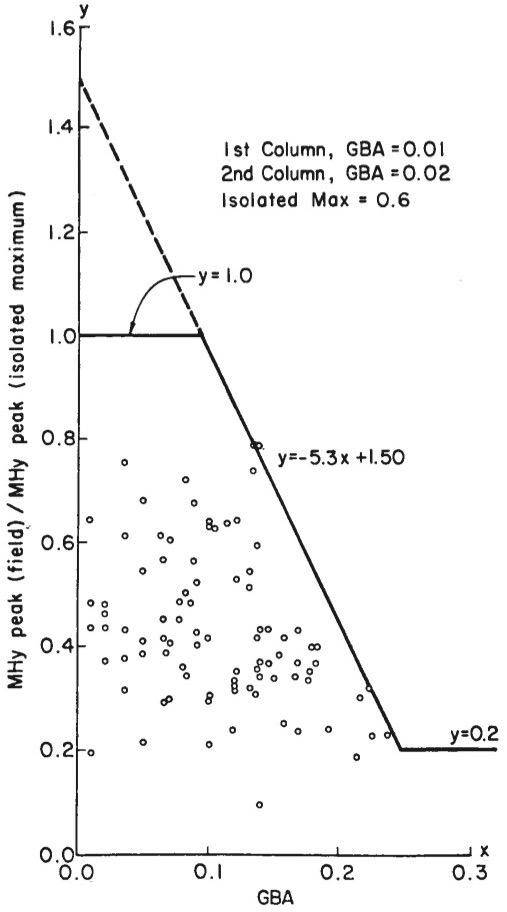 Figure 10: Typical action ratio as a function of the GBA parameter (after [13])
The same technique can be applied to any heliostat geometry in a field of many identical objects. For example, another design was a circular parabolic dish collector (Figure 11).
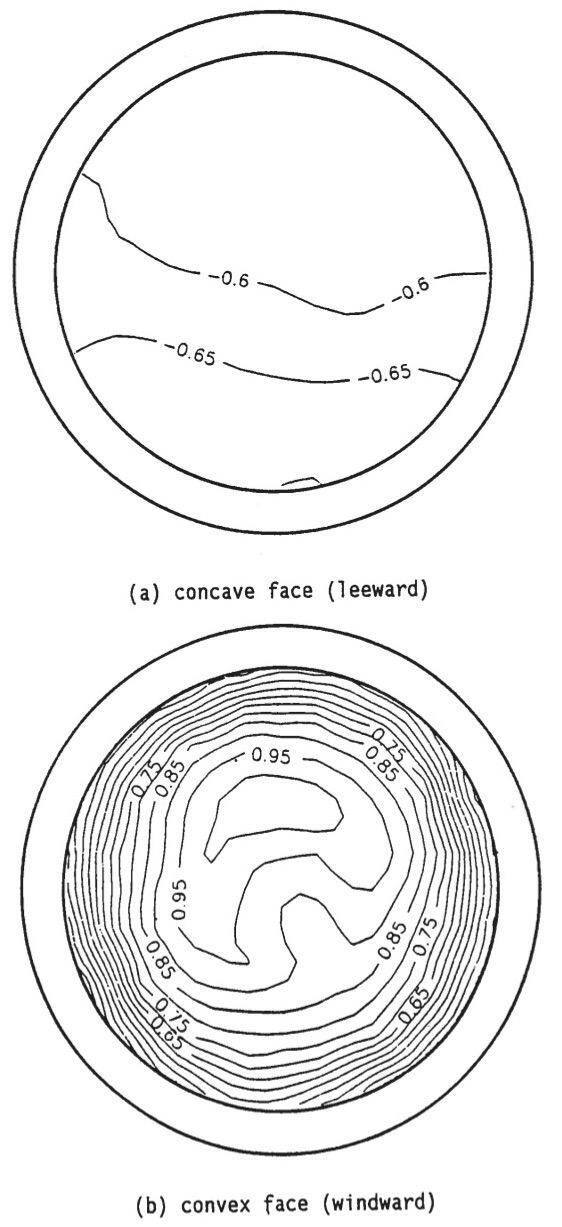 Figure 11: Pressure coefficient contours for a vertical dish collector with perpendicular wind on to the convex face (after [12])
This circular design had several drag and lift reduction techniques explored by the lead researcher, R.G. Derickson, in the boundary-layer wind tunnel. Although never published, the annulus-spoiler concept, shown in Figure 12, was the most promising as it appeared to reduce both the peak drag and peak lift coefficients. If not already done, these flow control ideas should be explored further to reduce costs of heliostat systems. It is worth noting that this spoiler technique has been successful applied to reduce roof loads (Banks et al. [14]).
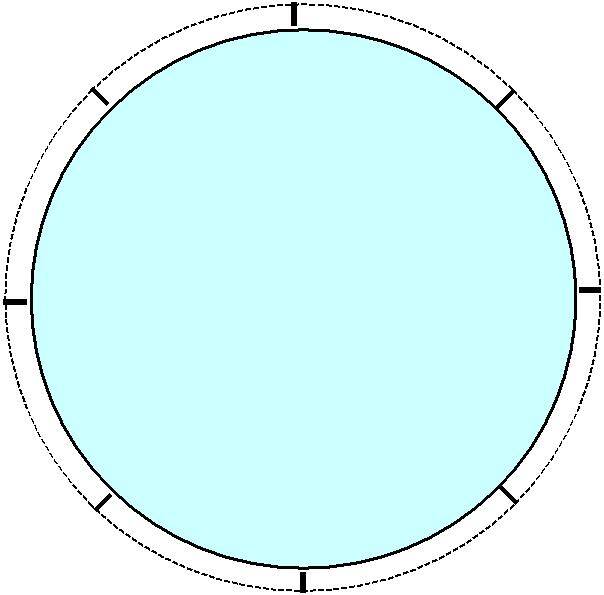 Figure 12: The parabolic dish annulus-spoiler concept used by Derickson to explore drag and lift reduction in one of the boundary-layer wind tunnels at Colorado State University. (Image represents the front view of the disk.)
4 Parabolic Troughs
More recently work by Hosoya et al. [15] looked at wind loads on ground-based parabolic troughs within a field identical long elements (Figure 14) for a selected variety of wind azimuths (perpendicular approach flow shown here). A small segment instrumented with strain gauges (Figure 13) was used to understand the torque to be accommodated by the full-scale tracking mechanism. A pressure model (Figure 15) was used to understand the differential pressures across the parabolic surface at various tilt angles. The model in Figure 15 has pressure paths “grown” into the stereolithographic surface, resulting in many tap pairs spread over the two surfaces of the curved trough (one front and one rear).
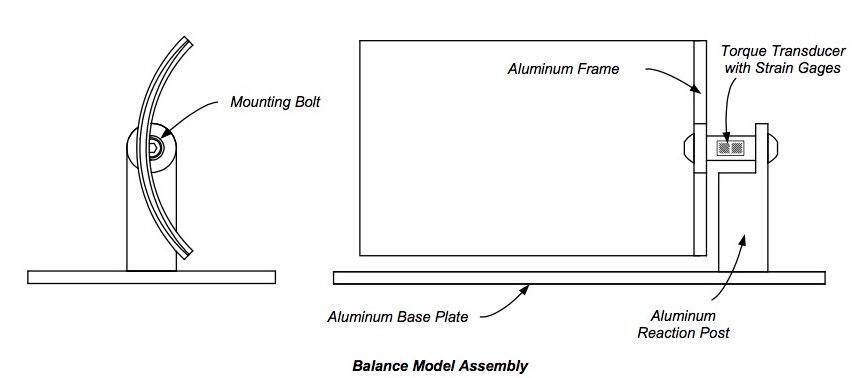 Figure 13: A portion of the trough wasmounted on a lift/drag force balance (not shown). The portion shown here has a custom strain-gauged torsion element to estimate pitching moment for motor design in the full scale (after [15]).
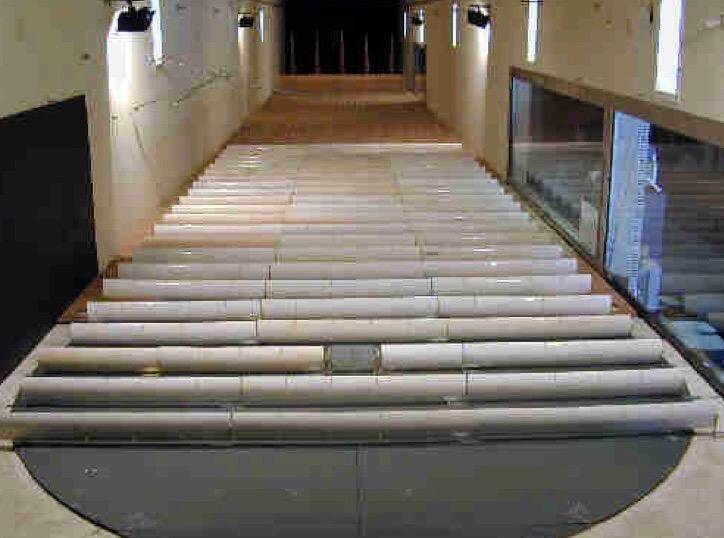 Figure 14: An instrumented module within afield of trough collectors explored by Hosoya etal. [15] at CPP Inc. in the early 2000s.
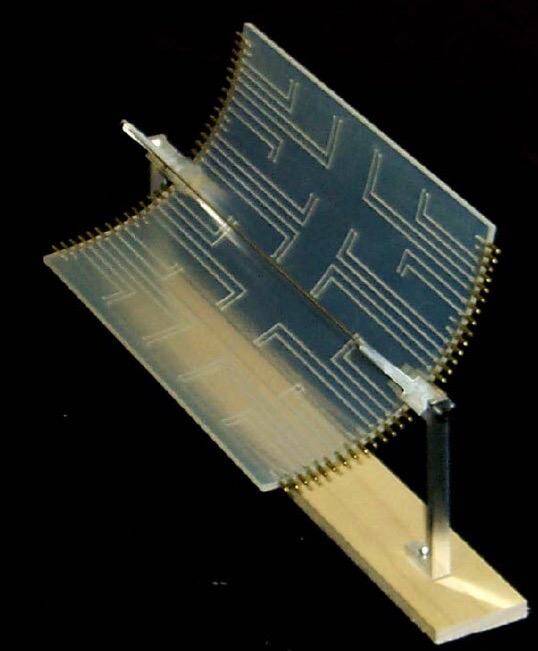 Figure 15: The instrumented region in Figure14 was filled with a pressure tapped part of the trough. This aided in understanding the distribution of pressures during wind loading (after [15]).
Figures 16 and 17 are taken from Hosoya et al. [15] and the latter illustrates the reduced mean velocities that exist further into the field of trough collectors, and the increased turbulence intensity (mechanism in Figure 16) away from the field edge. As a consequence it is possible to have similar (or even larger) peak loads within a large field than on the edges. The former location many have low mean loads but larger peak values due to the increased ambient gustiness, while the perimeter locations may be experiencing higher mean loads with lesser magnitude peak component due to the more modest approach turbulence.
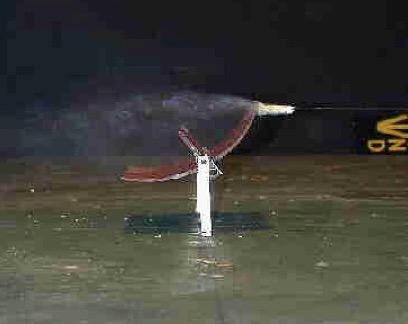 Figure 16: Flow visualization of the separated turbulent flow off the top edge of a thermal trough collector (after [15]).
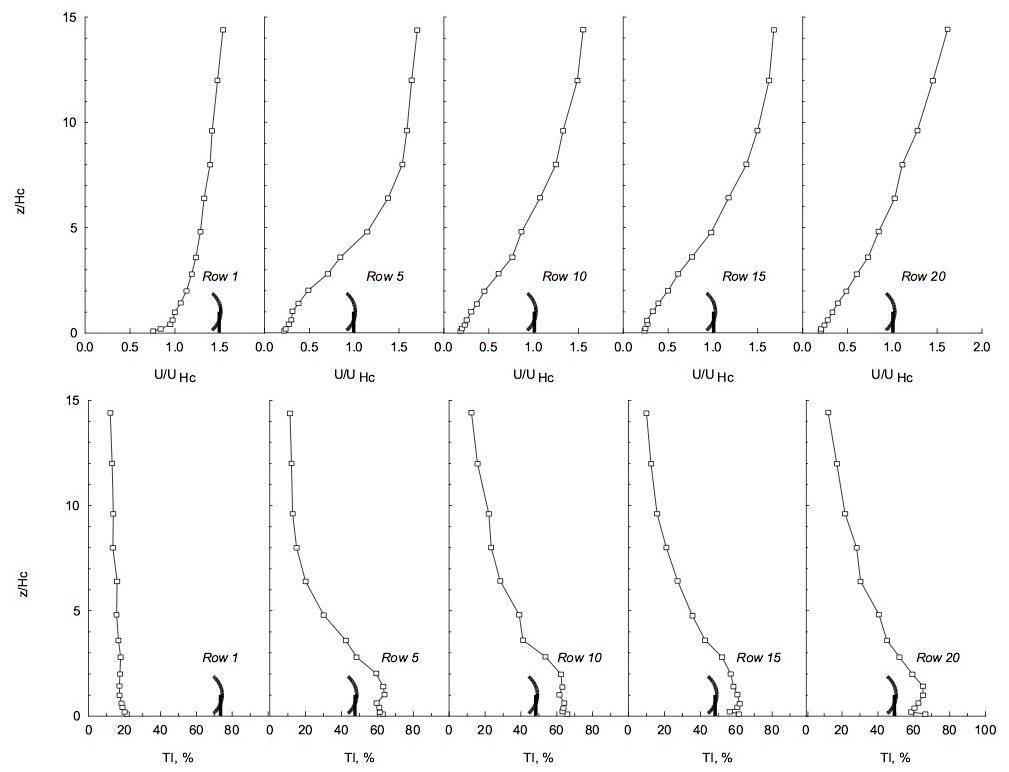 Figure 17: The mean and turbulent flow characteristics vary from the front of the field to the inner regions (after [15]).
5 Architectural Applications
PV systems are almost an architectural default in modern Australian building design. Many new commercial and residential building roofs are being designed with tilted PV arrays over much of the roof. In some Asian equatorial countries the PVs are elevated a couple of metres on a frame. This keeps the roof plant more accessible for the maintenance team and provides some solar protection for the plant underneath; while maximizing the PV area on the roof. That said, as the real price of these energy-generating appurtenances comes down the PV is finding itself on other building surfaces. Several tall buildings in the US are using PVs as spandrel panels on the glazed façade, while other uses include being the lone protective roof surface for a company carpark (Figure 18). The extent of this design can be seen in the Google Earth image (Figure 19).
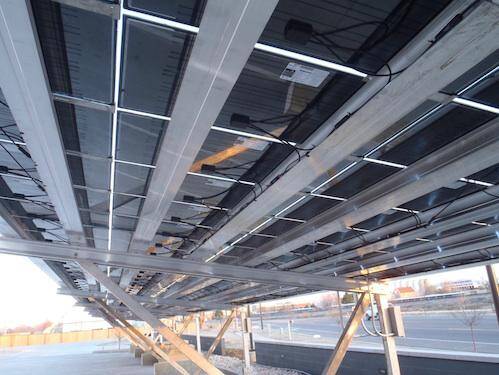 Figure 18: A commercial carport roof iscomposed of glazed PV panels; generating power for the owner and providing protection for employees’ cars.
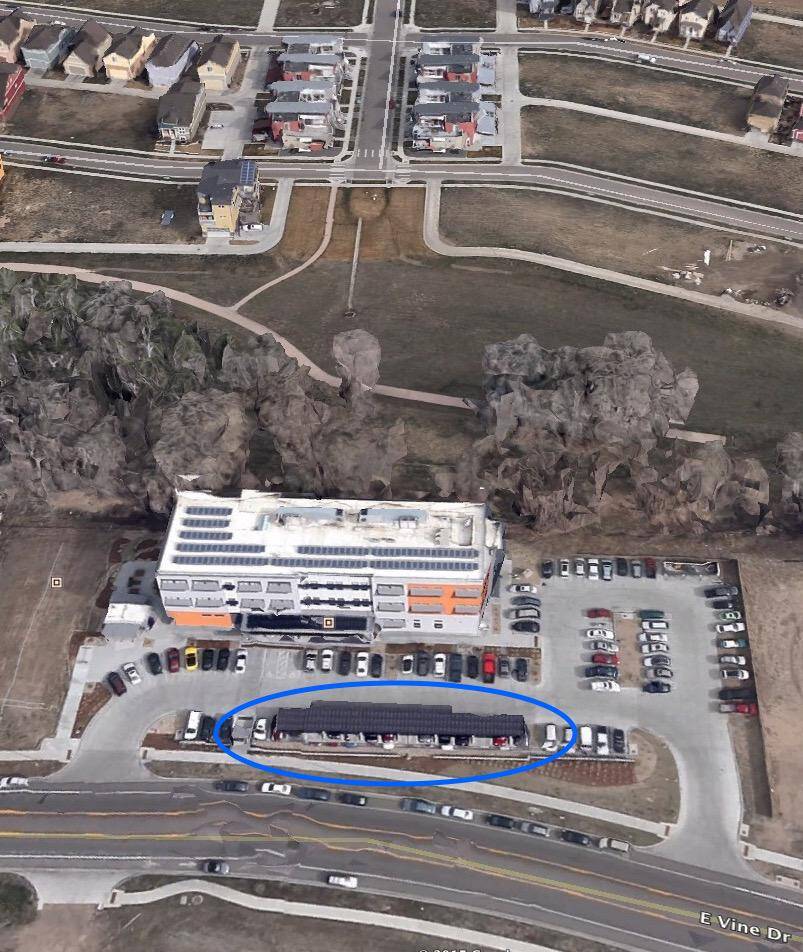 Figure 19: A Google Earth view of the PVcarport roof at the Czero Inc building in Fort Collins, Colorado, detailed in Figure 18.
One innovative company in the USA (P4P Inc.) is experimenting with two-dimensional cable net structures to cover large carpark areas or waterways (both protect what is below; car heating in summer or evaporation of the precious water supply, respectively). Figure 20 shows the intent and one prototype example is in Figure 21. These designs require good wind-engineering input when one considers the potential for dynamic response . Unfortunately, like many of the recent wind-tunnel work on solar projects, these efforts are proprietary to the company funding the work and so the data rarely become public knowledge until years later, if ever. Of course, government funded research, such as many of the references cited here, is in the public domain.
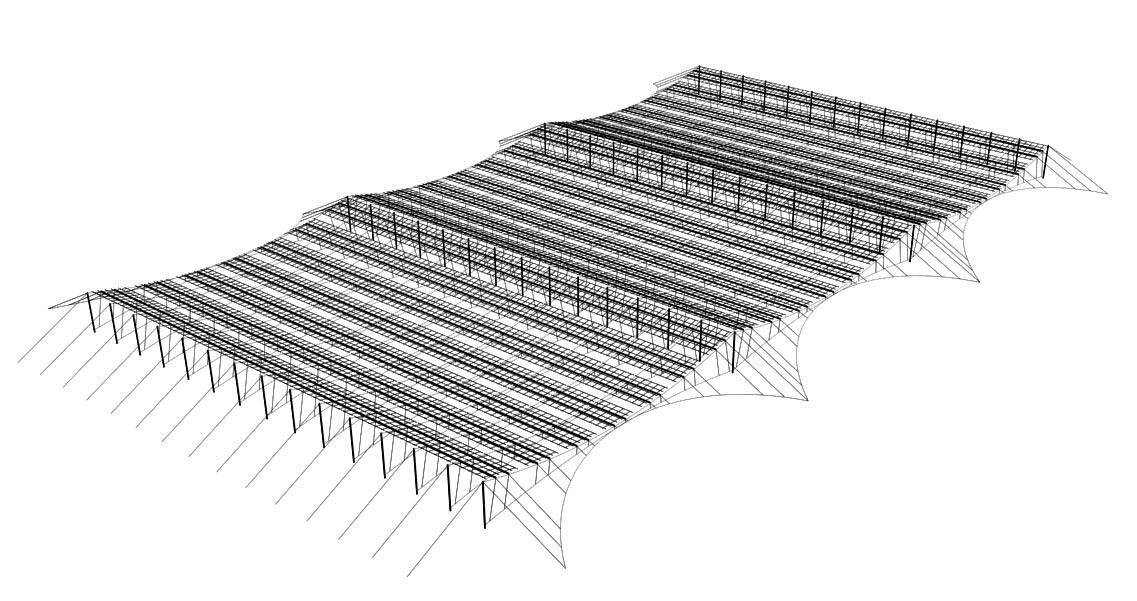 Figure 20: A large 2D cable net structure designed to cover a large parking area.
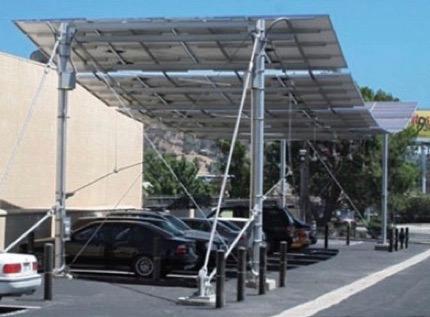 Figure 21: A full-scale prototype cablestructure for PV support (after P4P Inc.).
6 Ballasted Systems
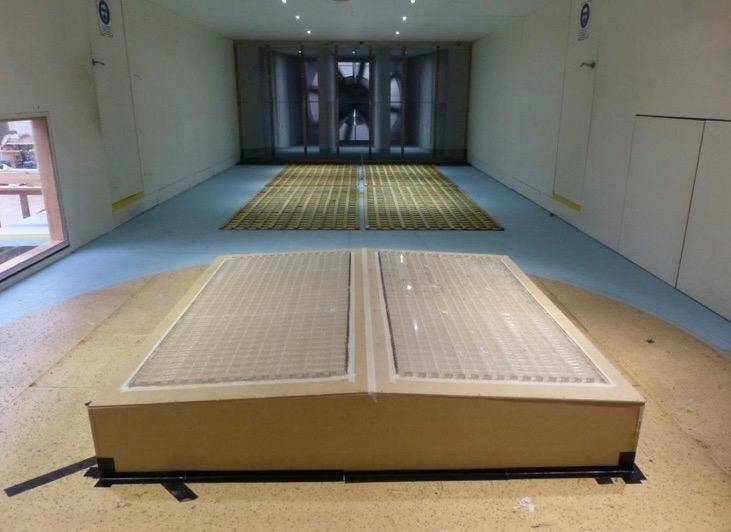 Figure 22: The 1:50 warehouse model with the PoweRak low-tilt-angle arrays installed in the MEL Consultants wind tunnel (after [16]).
A local Australian company, PoweRak, has developed a unique low-tilt-angle rack system that targets PV systems in equatorial countries. The nominal slope of five degrees is principally intended to allow rainwater to run off. Since cyclones and hurricanes do not occur within about ten degrees each side of the equator the design windspeeds are quite low in these locales. For example, the design pressures in Singapore are about half of that used in many Australian cities. As such, the designer has the option of designing a system based on self-weight and the need to penetrate the roof surface can be avoided. Depending on the geographic location, roof shape, module location relative to roof corners, parapets, and PV mass there may be a need for ballast at some edge and corner locations.
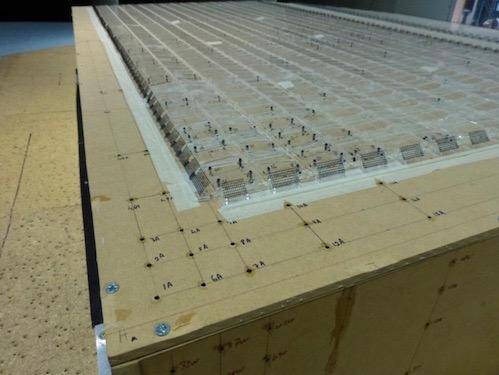 Figure 23: A close-up view of the 1:50 PoweRak model with one style of perimeter porous fence being examined (after [16]).
In order to understand the flow regime around the PoweRak product on a typical warehouse roof MEL Consultants was commissioned to use a 1:50 model in the wind tunnel and provide differential pressure data. Figure 22 shows one of the designs in the boundary-layer wind tunnel.
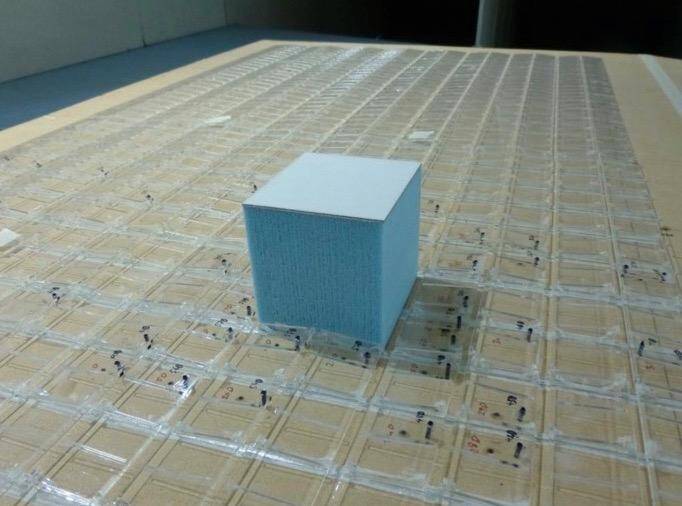 Figure 24: During this study the impact of large rooftop features, such as an elevator overrun, were investigated. The local PV wind loads are increased by accelerated wind flow near these features (after [16]).
Part of the scope entailed exploring the use of porous edge screens around the perimeter of the PV area (Figure 23). The result of this idea (not new, since similar ideas are shown in Figure 2 from 1981 [6], and explored by Cochran and English [17] in 1997) was to make the uplift more uniform over the extent of the PV field. The edges and corners were no longer very high wind load areas and ballast could be decreased or avoided in some cases.
Figure 25: A large greenfield solar farm at Colorado State University containing fixed and tracking PV arrays (supplied by Carol Dollard).
7 Conclusions
Long before solar energy systems became so commonplace on our residential and commercial building roofs researchers were exploring the likely design wind loads for architectural installations and massive greenfield solar farms (Figure 25). Studies that were funded through government or non-profit organizations typically have the data in the public domain. Private studies performed by laboratories in North America, Europe, and Australia are usually commercial-in-confidence and are less likely to be available to the industry in general. That said, there are so many old and current wind-tunnel studies that pertain to common PV shapes and locales that some design guides are appearing [e.g. 1, 2, and 5] that conservative design parameters are available. However, for a specific design in and open greenfield, or building location for architectural applications, recourse to a physical model in the wind tunnel is still the preferred way to optimize the facility.
Acknowledgements
Thanks to Ross Woodfield of PoweRak and Carol Dollard of CSU for allowing use of their images in this paper, and for Suzanne Leonard for reviewing the text herein.
References
- R. LaPlante and J. Maffei (Editors), 2012, “Wind Design for Low-Profile Solar Photovoltaic Arrays on Flat Roofs”, Structural Engineers Association of California Report SEAOC PV2-2012, 38 pages.
- C.V. Bentum, 2013, “NEN 7250 Proposal”,TNO Presentation, 61 pages.
- T. Koster, 2012, “Solar Energy System Storm-Resistant”, TNO Publication, 2 pages.
- R.D. Miller and D.K. Zimmerman, 1979, “Wind Loads on Flat Plate Photovoltaic Array Fields, Phase II”, Jet Propulsion Laboratory Report #DOE/JPL 954833-79/2, 112 pages.
- S. Barkaszi and C.O’Brien, 2010, “Wind Load Calculation for PV Arrays”, Solar AmericaBoard for Codes and Standards Publication,24 pages.
- R.D. Miller and D.K. Zimmerman, 1981, “Wind Loads on Flat Plate Photovoltaic Array Fields, Phase III”, Jet Propulsion Laboratory Report #DOE/JPL 954833-81/3, 397 pages.
- J.A. Peterka. N. Hosoya, L.S. Cochran and J.E. Cermak, 1998, “Area-Average Peak Pressures in a Gable Roof Vortex Region”, Journal of Wind Engineering and Industrial Aerodynamics, vol. 77&78, pp. 205-215.
- L.S Cochran, 1986, ”Influence of Porosity on the Mean and Peak Wind Loads for Three Concentrator Photovoltaic Arrays”, Master of Science Thesis, Colorado State University, pp434.
- S. Masia, 2010, “Concentrating Photovoltaics”,Solar Today Magazine, pp 42.
- G.A. Kopp, D. Surry and K. Chen, 2002, “Wind Loads on a Solar Array”, Wind and Structures, vol. 5, no. 5, pp. 393-406.
- J.A. Peterka and R.G. Derickson, 1990, “Wind Load Design Guide for Ground Based Heliostats and Parabolic Dish Collectors”,Report prepared for Sandia National Laboratories by Colorado State University, 36pages.
- J.A. Peterka and R.G. Derickson, 1992, “Wind Load Design Methods for Ground-BasedHeliostats and Parabolic Dish Collectors”,Sandia National Laboratory Report #SAND92-7009, 80 pages.
- J.A. Peterka, Z. Tan, J.E. Cermak and B. Bienkiewicz, 1989, “Mean and Peak Wind Loads on Heliostats”, ASME Journal or SolarEnergy Engineering, vol. 111, pp. 158-164.
- D. Banks, P.P. Sarkar, F. Wu and R.N. Meroney, 2001, “A Device to Mitigate Vortex Induced Rooftop Suction”, Proceedings of the Ninth Americas Conference on Wind Engineering, Clemson, USA, June 3-6, 14pages.
- N. Hosoya, J.A. Peterka, R.C. Gee and D.Kearny, 2008 “Wind Tunnel Tests of Parabolic Trough Solar Collectors”, National Renewable Energy Laboratory Report #NREL/ SR-550-32282, 243 pages.
- J. Kostas, Y. Padayatchy, E. Chong, J.Tan and W. H . Melbourne, 2015 , “ Wind Tunnel Measurements of Pressures on the PowerRak Solar Panel Arrays on an Industrial Warehouse Building”, MEL Consultants Report #93/13, 91 pages.
- L.S. Cochran and E.C. English,1997,“Reduction of Roof Wind Loads by Architectural Features”, ArchitecturalScienceReview, vo. 40, no. 3, pp. 79-87.
- T. Stathopoulos, E. Xypnitou and I. Zisis, 2013, “Wind-Induced Loads on Rooftop and Ground Photovoltaic Panel Systems“, Proceedings of the Twelfth Americas Conference on Wind Engineering, Seattle, USA, June 16-20, 9 pages.
- L.S. Cochran, 2010, “Contemporary Architectural Aerodynamics and the Future of Wind Engineering”, Proceedings of the International Workshop on Wind Engineering Research and Practice – Current State of the Art and Future Needs, Chapel Hill, USA, May 28-29, 23 pages.
- K. Strobel and David Banks, 2013, “Effects of Vortex Shedding in Arrays of Long Inclined Flat Plates and Ramifications for Ground-Mounted Photovoltaic Arrays“, Proceedings of the Twelfth Americas Conference on Wind Engineering, Seattle, USA, June 16-20, 7 pages.
- L.S. Cochran and R.G. Derickson, 2011, “APhysical Modeler’s View of Computational W i n d E n g i n e e r i n g ”, Journal of Wind Engineering and Industrial Aerodynamics, vol.99, no. 4, pp. 139-153.
- L.S. Cochran, J. Peterka and R. Derickson, 1999, “Roof Surface Wind Speed Distribution on Lowrise Buildings”, Architectural Science Review, vo. 42, no. 3, pp. 151-160.
© 2015 Solar Choice Pty Ltd
- On Wind Load Reduction: Solar Arrays in the Field and Building Roofs - 1 September, 2015
Hi,
Its really great concept. It looks very pretty, but I think it is a really challenging job. Thanks for this informative article.
Cheers!