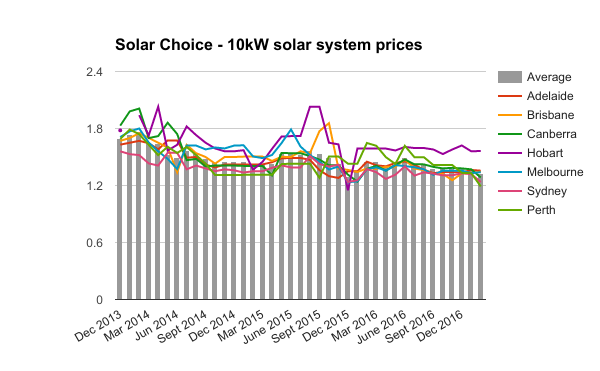
Despite the decrease in the incentive available under the federal Renewable Energy Target that came in effect from last month, average solar PV system prices have moved little, according to our data. Although this month did see a slight reduction in prices (down to $1.60 per watt from $1.62/W in February), this is mainly attributable to changes in pricing for 10kW solar systems; prices for other system sizes remained almost the same as the previous few months.
Average solar PV system prices for February 2017
Prices in the table below include both the up-front incentive available for small-scale systems through the Renewable Energy Target and GST – they represent the total retail cost of the system to the customer. We’ve left fields blank where there were only a small number of price points available in our database (usually less than 3).
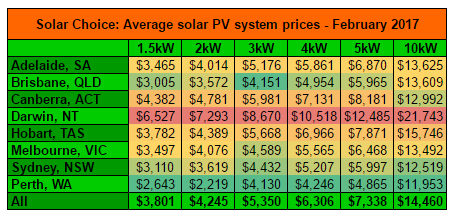
Prices for each system size are colour-coded. (Dark red for highest, dark green for lowest, yellow for middle.)
Solar system prices for February: $/W medians, highs & lows
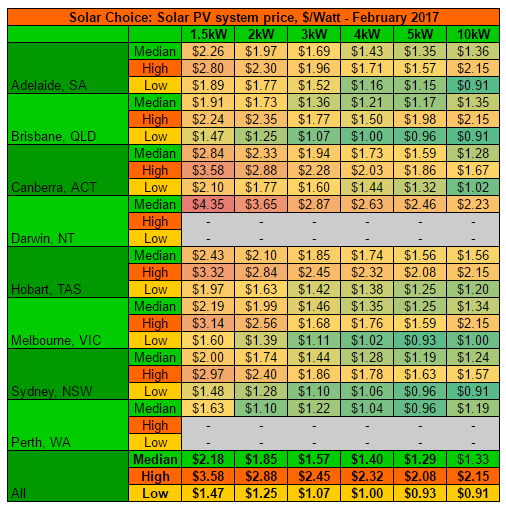
Prices above are colour-coded across highs, lows & medians for all cities and system sizes. (Dark red for highest, dark green for lowest, yellow for middle.)
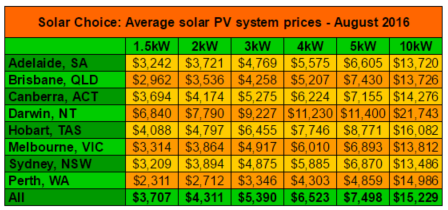
Historic solar PV system prices (since August 2012)
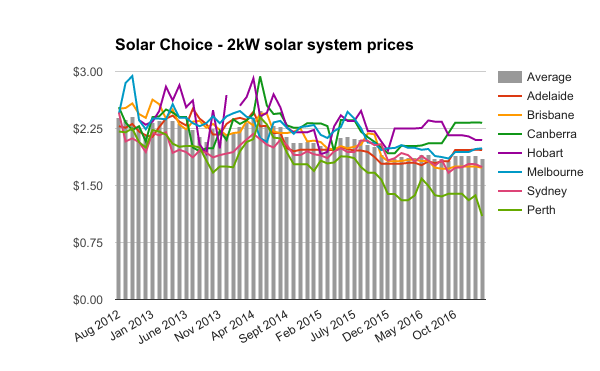
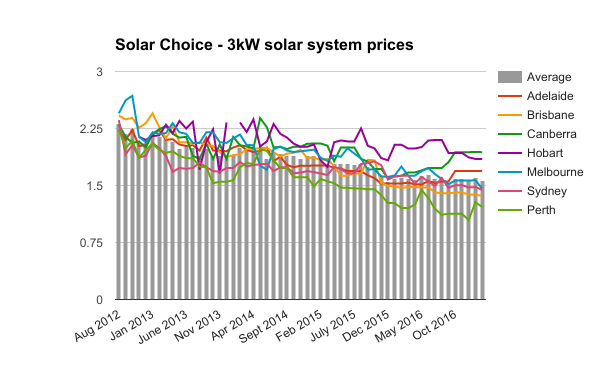
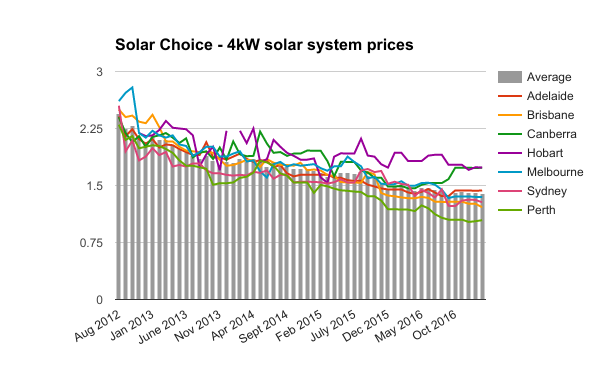
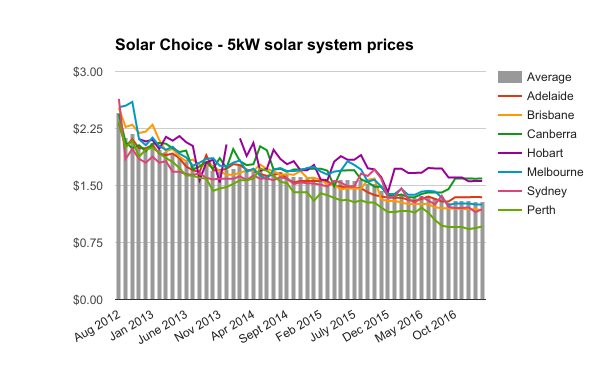
The historic pricing in the tables below does not reflect prices for Darwin, NT. See ‘About this data’ footnote below for a more detailed description of where this data comes from and what it represents.
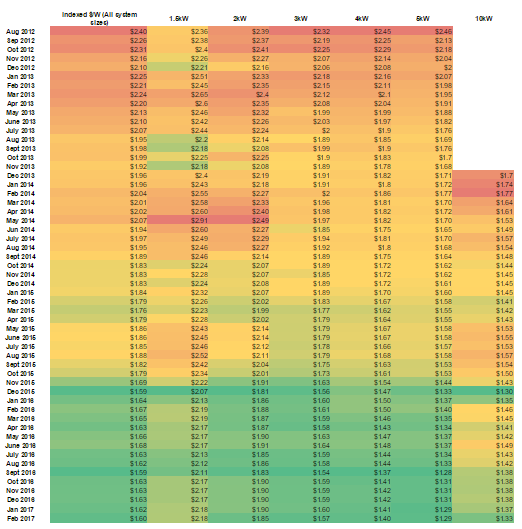
Colour-coded historic average solar system prices ($/W). (Dark red for highest, dark green for lowest, yellow for middle.)
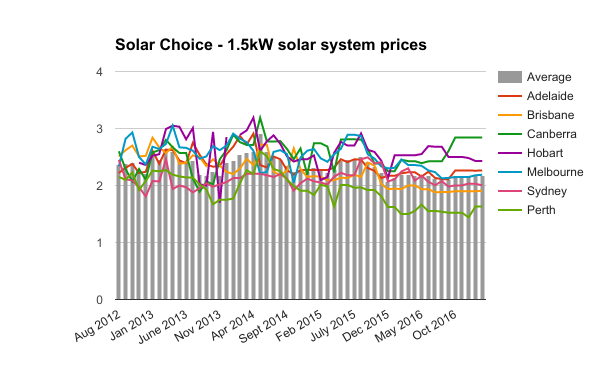
All $/W solar system prices (Historic)
The chart below provides an at-a-glance look at solar PV system pricing trends since August 2012. Data points are the average of average $/W for each system size (1.5kW-5kW until Nov 2013, then also including 10kW from Dec 2013).
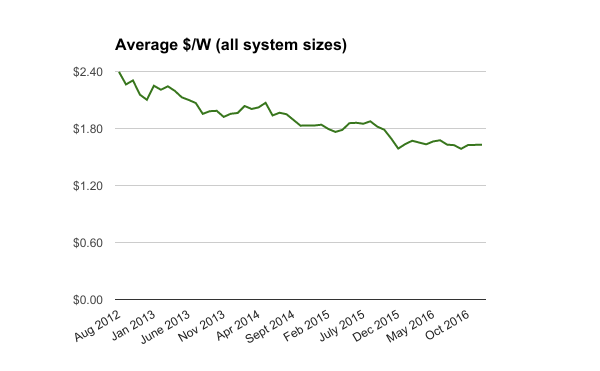
(N.b. Please see note about ‘Solar Choice Discount’ in February 2016 edition of the PV Price Index.)
About this data
Tables and charts included in this article were compiled using data from Solar Choice’s installer network database, which contains regularly-updated pricing and product details from over 100 solar installation companies across Australia. Prices do not ordinarily incorporate meter installation fees or additional costs for difficult installations. ‘Premium’ installer offerings are excluded from calculations. Pricing data from Darwin is not included any of the charts showing historic trends.
© 2017 Solar Choice Pty Ltd

- EV Charging Backbone at Surry Hills Apartment Building - 30 March, 2026
- The Top 5 Problems With Cheap Air Conditioning Quotes - 12 January, 2026
- Running Cost of Air Conditioners – Explained - 7 October, 2025