The Solar Choice Price Index for January 2013, is the first to contain updated installer prices in response to the early closure of the Solar Credit scheme on 1 January 2013. After the publication of our December Price Index some installers announced that they would honour the quoted system prices for contracts entered into before the end of 2012. As is to be expected the cost of solar PV systems have risen, however, this rise has been mitigated by an increase in the value of Renewable Energy Certificate’s (REC’s).
The data contained in this report is generated from Solar Choice’s Australia wide network of installers, and provides a monthly up-date on the price of solar PV in and around Australia’s main cities (excluding Darwin). In addition to the cost of solar PV the report also includes variations in the price of Small-scale Technology Certificates (STCs), all figures take into account the STC discounts.
Cost of installed solar PV systems by city and system size
As a result of the early closure of the Solar Credit Scheme there has been an increase in the average price of a solar PV system across Australia, based on the REC price at the time of the announcement in mid November it was estimated that prices would increase between $700 and $1000 depending on the location of the household.
This months figures show that the rise has been in the region of $400 with variations either side, the average cost of a 1.5kW solar PV system has risen by just under $450 and a 5kW by just over $350 since December 1st. Although noticeably higher than December, dramatic reductions in the price of solar PV systems in the last few month of 2012 ensure that cost remain significantly lower than 18 months ago.
| Solar Choice: Average Solar PV System Prices – January 2013 | |||||
| 1.5kW | 2kW | 3kW | 4kW | 5kW | |
| Adelaide, SA | $3,911.60 | $4,895.90 | $6,567.00 | $8,473.04 | $10,211.56 |
| Brisbane, QLD | $4,255.81 | $5,257.89 | $7,345.99 | $9,719.41 | $11,500.44 |
| Canberra, ACT | $3,875.67 | $4,800.95 | $6,549.77 | $8,577.07 | $10,238.07 |
| Hobart, TAZ | $3,772.67 | $4,464.50 | $6,441.67 | $8,657.00 | $10,512.00 |
| Melbourne, VIC | $4,013.44 | $4,754.44 | $6,601.22 | $8,895.22 | $10,665.00 |
| Sydney, NSW | $3,119.83 | $4,384.14 | $6,178.43 | $7,964.57 | $9,407.71 |
| Perth, WA | $3,390.20 | $4,455.40 | $6,141.20 | $8,120.80 | $9,976.80 |
| ALL | $3,762.75 | $4,716.17 | $6,546.47 | $8,629.59 | $10,358.80 |
Increases across the states are largely uniform, with Hobart fairing slightly better than Brisbane. This is possibly as a result of the lower number of STC’s available to Tasmanian customers due to their location in REC Zone 4.
Solar PV System prices by city and system size – cost per watt
The average price per watt has risen by between 7¢ and 30¢, pushing the cost per watt back up to over $2. The exception to this is a 4kW system in Sydney which sits just under the $2 mark, at $1.99 per watt. The most cost effective systems per watt remain 3kW, 4kW and 5kW.
| Solar Choice: Solar PV System Prices per Watt – January 2013 | |||||
| 1.5kW | 2kW | 3kW | 4kW | 5kW | |
| Adelaide, SA | $2.61 | $2.14 | $2.17 | $2.11 | $2.03 |
| Brisbane, QLD | $2.84 | $2.63 | $2.45 | $2.43 | $2.30 |
| Canberra, ACT | $2.58 | $2.40 | $2.18 | $2.14 | $2.05 |
| Hobart, TAZ | $2.52 | $2.34 | $2.15 | $2.16 | $2.10 |
| Melbourne, VIC | $2.68 | $2.38 | $2.20 | $2.22 | $2.13 |
| Sydney, NSW | $2.08 | $2.19 | $2.06 | $1.99 | $1.88 |
| Perth, WA | $2.26 | $2.23 | $2.05 | $2.03 | $2.00 |
| ALL | $2.51 | $2.33 | $2.18 | $2.16 | $2.07 |
Solar PV system prices – highs and lows
The minimum price for a fully installed solar PV system has shown the most change with an increase of around $200. The maximum system costs have changed only at the lower sizes, 1.5kW is $50 more expensive and a 2kW premium has increased by around $300.
| Solar Choice: Solar System Prices Max and Min – January 2013 | |||||
| 1.5kW | 2kW | 3kW | 4kW | 5kW | |
| Min | $2,175 | $3,499 | $5,063 | $6,496 | $8,281 |
| Max | $5,190 | $6,449 | $9,132 | $11,768 | $14,694 |
Average STC discount
The increase in value of REC’s that was first identified at the beginning of December, has continued into January. The average price of a STC has increased by up to 30¢. Although homeowners will receive fewer STC’s and a lower discount on their solar PV system, the rising value of the STC has offset impact of the 2x multiplier ending.
| Solar Choice: Average STC discount – January 2013 | |||||
| 1.5kW | 2kW | 3kW | 4kW | 5kW | |
| Adelaide, SA | $27.63 | $27.63 | $27.50 | $27.63 | $29.38 |
| Brisbane, QLD | $27.25 | $27.21 | $27.21 | $27.21 | $27.21 |
| Canberra, ACT | $28.25 | $28.25 | $28.25 | $28.25 | $28.25 |
| Hobart, TAZ | $27.00 | $26.67 | $27.00 | $27.00 | $27.00 |
| Melbourne,VIC | $28.29 | $28.14 | $28.29 | $28.29 | $27.57 |
| Sydney, NSW | $28.80 | $29.00 | $29.00 | $29.00 | $29.00 |
| Perth, WA | $27.60 | $27.60 | $27.60 | $27.60 | $27.60 |
| ALL | $27.83 | $27.79 | $27.84 | $27.85 | $28.00 |
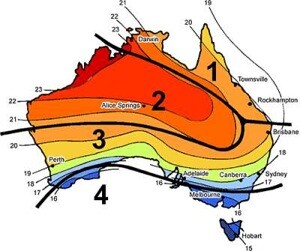
Australia is divided into a number of REC Zones and STC’s are allocated on this basis, regions that receive a great number of sunshine hours (such as Far North Queensland) are allocated a greater number of STCs, whilst those in less sun-blessed areas (such as Victoria and Tasmania) receive fewer. Prior to 1 January 2013, households investing in a solar PV system effectively received ‘double discount’ on the first 1.5kW installed through the Solar Credit Scheme. Although this particular scheme has now ended, there are still Federal incentives available to help offset the cost of investing in a solar PV system.
Although the overall price of the STC’s have changed the maximum and minimum figures remain the same. A 5kW system varies between $43 per and $23, while the STC’s for a 1.5kW system may be worth as much as $30 per STC.
About Solar Choice
Solar Choice has helped over 50,000 Australian households make a well-informed choice of solar power installer. With over 100 of Australia’s top installers on our network, we provide free and impartial Solar Quote Comparisons for customers across the country. Our Commercial Tender Management Team has worked on a wide range of commercial-scale solar PV projects throughout Australia, including solar farms and utility-scale solar PV plants.
© 2013 Solar Choice Pty Ltd

- NSW Club industry choosing solar power, with help from Solar Choice - 16 October, 2014
- 100% Renewables celebrates solar BBQ success - 26 February, 2013
- Coal fired power station in Queensland to be converted to ‘clean energy park’ - 21 February, 2013
Are your $/W system prices pre or post-subsidy?
Hi Greg,
All our figures include the Federal Government solar rebates or STC discounts.
OK… Thank you for the precise explanation.
Can you explain how the multipliers have changed? Which part of the calculation changed? Can you point me to a reference document? Here’s what I had for the 1.5, 2, 3, 4 & 5 KW brackets.
Adelaide, SA 62 72 93 114 134
Brisbane, QLD 62 72 93 114 134
Canberra, ACT 62 72 93 114 134
Hobart, Taz 53 62 79 97 115
Melbourne, VIC 53 62 79 97 115
Sydney, NSW 62 72 93 114 134
Perth, WA 62 72 93 114 134
When the Solar Credit Scheme was in place, customers received additional STCs for the first 1.5kW of their system. The date that your solar PV system was installed effected the number of times the STCs for the first 1.5kW was multiplied. Customer who installed between 1 July 2010 and 30 June 2011 received 5x the STCs; this was reduced to 3x for customers who installed between 1 July 2011 and 30 June 2012 and was reduced to 2x from 1 July 2012.
The 2x multiplier was originally supposed to end on 30 June 2013 but the Government announced its early closure on 16 November 2012 and the scheme ended on 1 January 2013. At the present time we have a 1x or no multiplier situation.
You can read more information about the Solar Credit Scheme on the Clean Energy Regulators website.