The year 2010, just come to a close, treated the Australian solar power industry remarkably well, with more than 100,000 installations nationwide. To put this number in context, it is useful to consider the fact that between 2001 and 2009–almost an entire decade–the number of solar installations for the country as a whole totaled just over 80,000. The astounding progress made this year occurred thanks to a number of factors, including generous incentive schemes (such as the solar credit rebate scheme and feed-in tariffs), the increasing affordability of photovoltaic technology, and a growing social consciousness about why renewable energy sources are necessary for domestic and global energy and climate stability.
This uptake in solar power was highlighted in Australia’s renewable energy industry peak body, the Clean Energy Council, which published its roundup report on the state of the renewable sector in the year 2010. The Clean Energy Australia 2010 report looks at trends in small scale and large scale clean and renewable technologies, as well as renewable energy jobs, investment in renewable technologies and installations, electricity prices, and other energy-related related topics.
One of the main reasons indicated by the report and cited by Clean Energy Council chief executive Matthew Warren for the rapid increase is, in addition to financial incentive policy mechanisms, the fact that energy prices are expected to rise by up to 66% in NSW and Queensland by 2015. This sharp price rise will be brought about by increasing energy demand and improvements to the aging grid infrastructure. Solar power producers will be in an advantageous position should this prediction come true, as they will stand to save money on energy bills or, in some cases, actually profit from the sale of their energy into the electricity grid. (We here at Solar Choice can help you find an installation appropriate for your circumstances. For a free quote comparison, please fill out the form here and we will get back to you ASAP.)
On the other side of this is the fact that the price of renewable energy technologies is slated to steadily decrease as they become more commonplace. The trend towards cheaper renewable energy is occurring even without factoring in the generous financial incentives currently being offered by state and federal governments; energy from certain renewable sources could be competitive with conventional generation in the mid-term future.
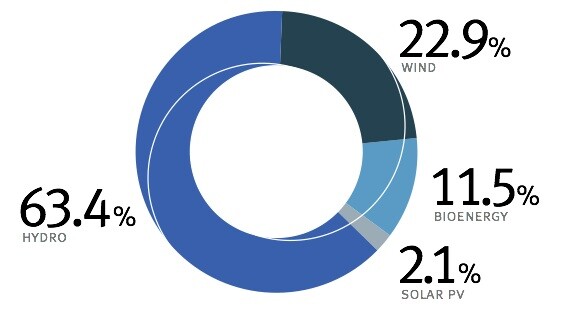
The federal government’s Renewable Energy Target (RET), which mandates that 20% of Australia’s energy supply come from renewables by 2020. According to the Clean Energy Council’s report, the percentage currently stands at 8.67% renewables (a total of 21,751GWh or gigawatt hours), most of which comes from hydropower and wind. The share from photovoltaics (solar) has been increasing, however, and currently stands at about 2% of the renewable energy produced (see Table 1 below). The RET is expected to continue to boost the renewable industry, driving growth and increasing the number of renewable energy jobs from the approximately 8,000 that currently exist to 55,000 by 2020.

Written by James Martin
Solar Choice Analyst
© 2010 Solar Choice Pty Ltd
Sources and Links:
Clean Energy Council, “Clean Energy Australia 2010” (pdf). (Thanks also to Clean Energy Council for the images and charts used in this entry.)
Sydney Morning Herald, “Aussies do their bit as solar panel use surges”
Australian Government Department of Climate Change and Energy Efficiency, “Renewable Energy Target”
Please also see our previous blog entries on how to calculate your federal solar credit discount and state by state solar feed-in tariffs. You can also learn a bit about renewable energies in industry-leading Germany and Europe in general by reading this entry and its associated links.
- Solar Power Wagga Wagga, NSW – Compare outputs, returns and installers - 13 March, 2025
- Monocrystalline vs Polycrystalline Solar Panels: Busting Myths - 11 November, 2024
- Solar Hot Water System: Everything You Need to Know - 27 February, 2024