It’s been well over a year since we first released our Solar & Battery Sizing & Payback Estimator tool in February 2016. Through its life so far, this handy tool has been visited by over 50,000 people trying to determine whether solar battery storage is worth the the money.
As a first effort, this tool was not bad (especially for a tool that is 100% free for anyone to use), but it had a number of limitations. The most obvious of these was the fact that the model was based only on two days’ worth of energy consumption & solar generation data. This allowed the user to get a very, very rough idea of what kind of impact a solar and/or battery system would have on their energy independence and electricity bills, but failed to even approximate the real-life, weather-related fluctuations in solar energy generation – and the impact that would have on a battery bank’s state of charge.
Get a free, instant quote comparison from companies in your area
Compare Solar & Battery Quotes
With this and other limitations gnawing at our minds, we set out to build a better, more accurate calculator tool. The new version – developed primarily by our engineers Yang Guo and Miya Zhou – features the below improvements.
While these don’t make the tool perfect, they do make it pretty good – especially for something that doesn’t cost any money to use.
- 365 days’ worth of solar irradiation data from the Bureau of Meteorology for each of Australia’s capital cities (this is a pretty big upgrade from the 2 days’ worth of data modelled in the previous version)
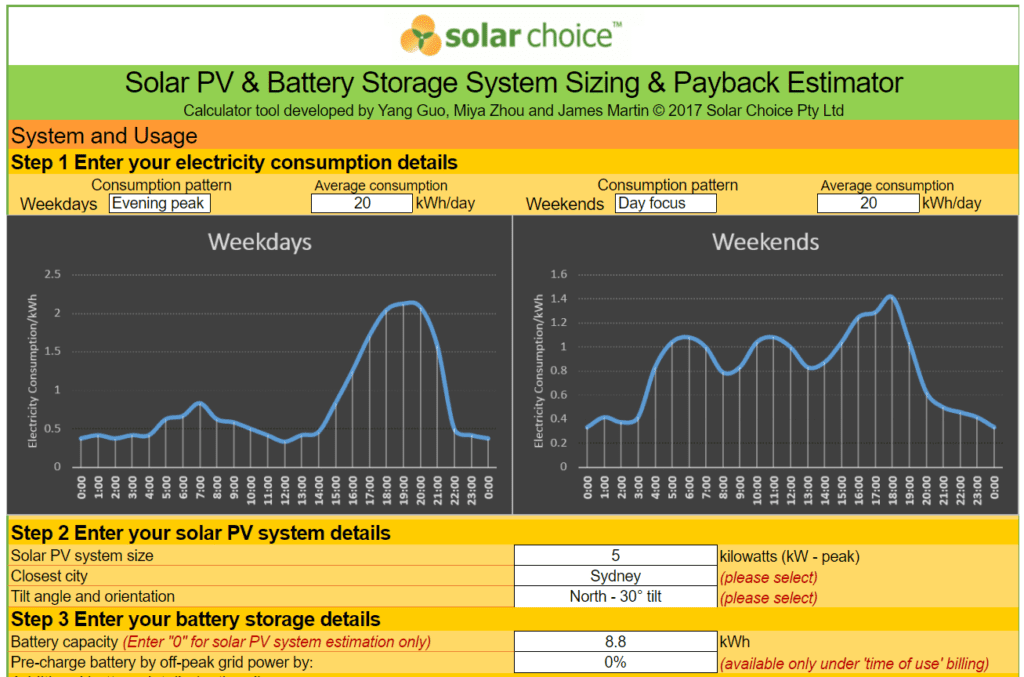
- Differentiation between weekday and weekend consumption habits to reflect the fact that most households consume energy differently 2 out of 7 days of the week
- Multiple orientation & tilt options, including ‘flat‘ (0 degree tilt); we wanted to include all orientations minus south at a range of tilt angles, but file size limitations prevented us from doing so (for now)
- New inputs for max battery power input & output (in kilowatts), to more realistically represent how a battery might charge up or meet demand throughout the day
- Modelling for solar panel degradation following a gradual downward curve to about 87% of original energy yields at year 20
- Modelling for battery degradation, with the user able to select from a range of common degradation curves
- More sophisticated and intuitive time of use schedule entry, including a pull-down menu for all the different networks in Australia
- Electricity price inflation input to help user anticipate how future grid electricity price increases will affect returns for the system
- Discount rate input for more accurate long-term financial calculations
- More sophisticated financial analysis – including internal rate of return (IRR) & net present value (NPV) based on a study period of 20 years
- Graphs for solar system output & loads as well as battery status (state of charge, charging/discharging) visible across the course of the year
- Graphs for solar-plus-battery & battery storage only cashflows over 20 years
- The calculator can no longer be downloaded (sorry – but we’ve worked hard on this and don’t want anyone repurposing it for their own sales & marketing purposes!)
More improvements in store
Over the coming weeks and months, we’ll be rolling out further improvements to this calculator, as well as to the suite of other tools in our Resource Library. These include the addition of internal rate of return (IRR) and net present value (NPV) outputs in the ‘Check the results’ section of the tool, as well as new-and-improved versions of our off-grid sizing & battery retrofit calculators.
To keep up to date, sign up for our weekly newsletter or follow us on Facebook:
© 2017 Solar Choice Pty Ltd

- Why a big battery could be cheaper than a small battery with the federal rebate? - 19 June, 2025
- Heat Pump Costs – Solar Choice Price Index - 1 June, 2025
- Solar Panel Costs: Solar Choice Price Index | July 2025 - 1 June, 2025