Since February of this year I’ve had Reposit Power’s Reposit First monitoring system installed at my Newcastle home. The goal has always been to write a review of how the system works – which I wanted to do after having a bit of time to get familiar with it. Four months has definitely been enough time, so here’s the review.
What is Reposit First?
Reposit First is a home energy monitoring system from Reposit Power, who are best known for their intelligent battery management software and GridCredits functionality. It consists of a device called a Reposit Box and Reposit’s cloud-based monitoring software, accessible via app or web portal.
The Reposit First solution was introduced by Reposit to cater to households without batteries, giving them access to the company’s monitoring software to better understand their energy consumption & solar energy generation patterns so that they can take control of their electricity bills.
In fact, Reposit First even works for homes with neither batteries nor solar; the energy consumption insights it provides can be used to help them make a decision about the most appropriately-sized system when the time comes to purchase one.
Households with Reposit First that decide to install batteries further down the track can take advantage of the advanced features that Reposit offers – including access to their smart battery management functionality and GridCredits electricity plans from their partner retailers.
How did I get Reposit First?
I have turned my home into something of a science experiment in energy monitoring, with three different monitoring systems installed on the wall alongside my solar inverters and meter box. The Reposit First unit was supplied and installed at no cost to me by Reposit Power for the purpose of this review, and to enable me to compare & contrast it against two other monitoring systems: carbonTRACK and Solar Analytics. The ultimate goal is to help households to make an informed decision about which – if any – of these systems would be best for them.
Although I had Reposit First retrofitted to my existing 4.4kW solar system (actually two separate 2.2kW systems), the reality is that households are more likely to have one put in alongside a brand new solar PV system. For households where batteries are installed alongside a solar PV system from the outset, Reposit’s system is simply called ‘Reposit’.
Monitoring apps on my phone: Reposit First, Solar Analytics, carbonTRACK & GoodWe (for one of my two solar systems).
Join our mailing list to follow along
Get a free, instant solar & battery quote comparison
Compare Solar & Battery Quotes
About Reposit Power
Reposit Power is a Canberra-based company founded with the aim of furthering the battery revolution by enabling battery storage system owners to tap into value streams beyond solar self-consumption. In other words, households with a Reposit-enabled battery don’t just save money on their energy bills by discharging their batteries when their home needs it – but also when the electricity grid needs it.
For ‘sharing’ their battery capacity with the grid, they get compensated in Reposit GridCredits, which help to reduce their electricity bills beyond the obvious, primary methods that solar & battery storage afford (namely: solar self-consumption, feed-in tariff credits & tariff arbitrage with batteries).
There are a number of companies out there offering similar services, but none of them are as prolific or high-profile as Reposit, who are widely recognised as an industry leader and make frequent appearances and commentary in the media.
What does their hardware look like & how does it sit in the meter box?
The Reposit Box is a squarish device that sits inside of your meter box alongside your switchboard or inside a separate weather-proof enclosure of its own (as in my case, with no room in the meter box). The Box itself is 90mm x 72mm.
A Reposit Box on its own.
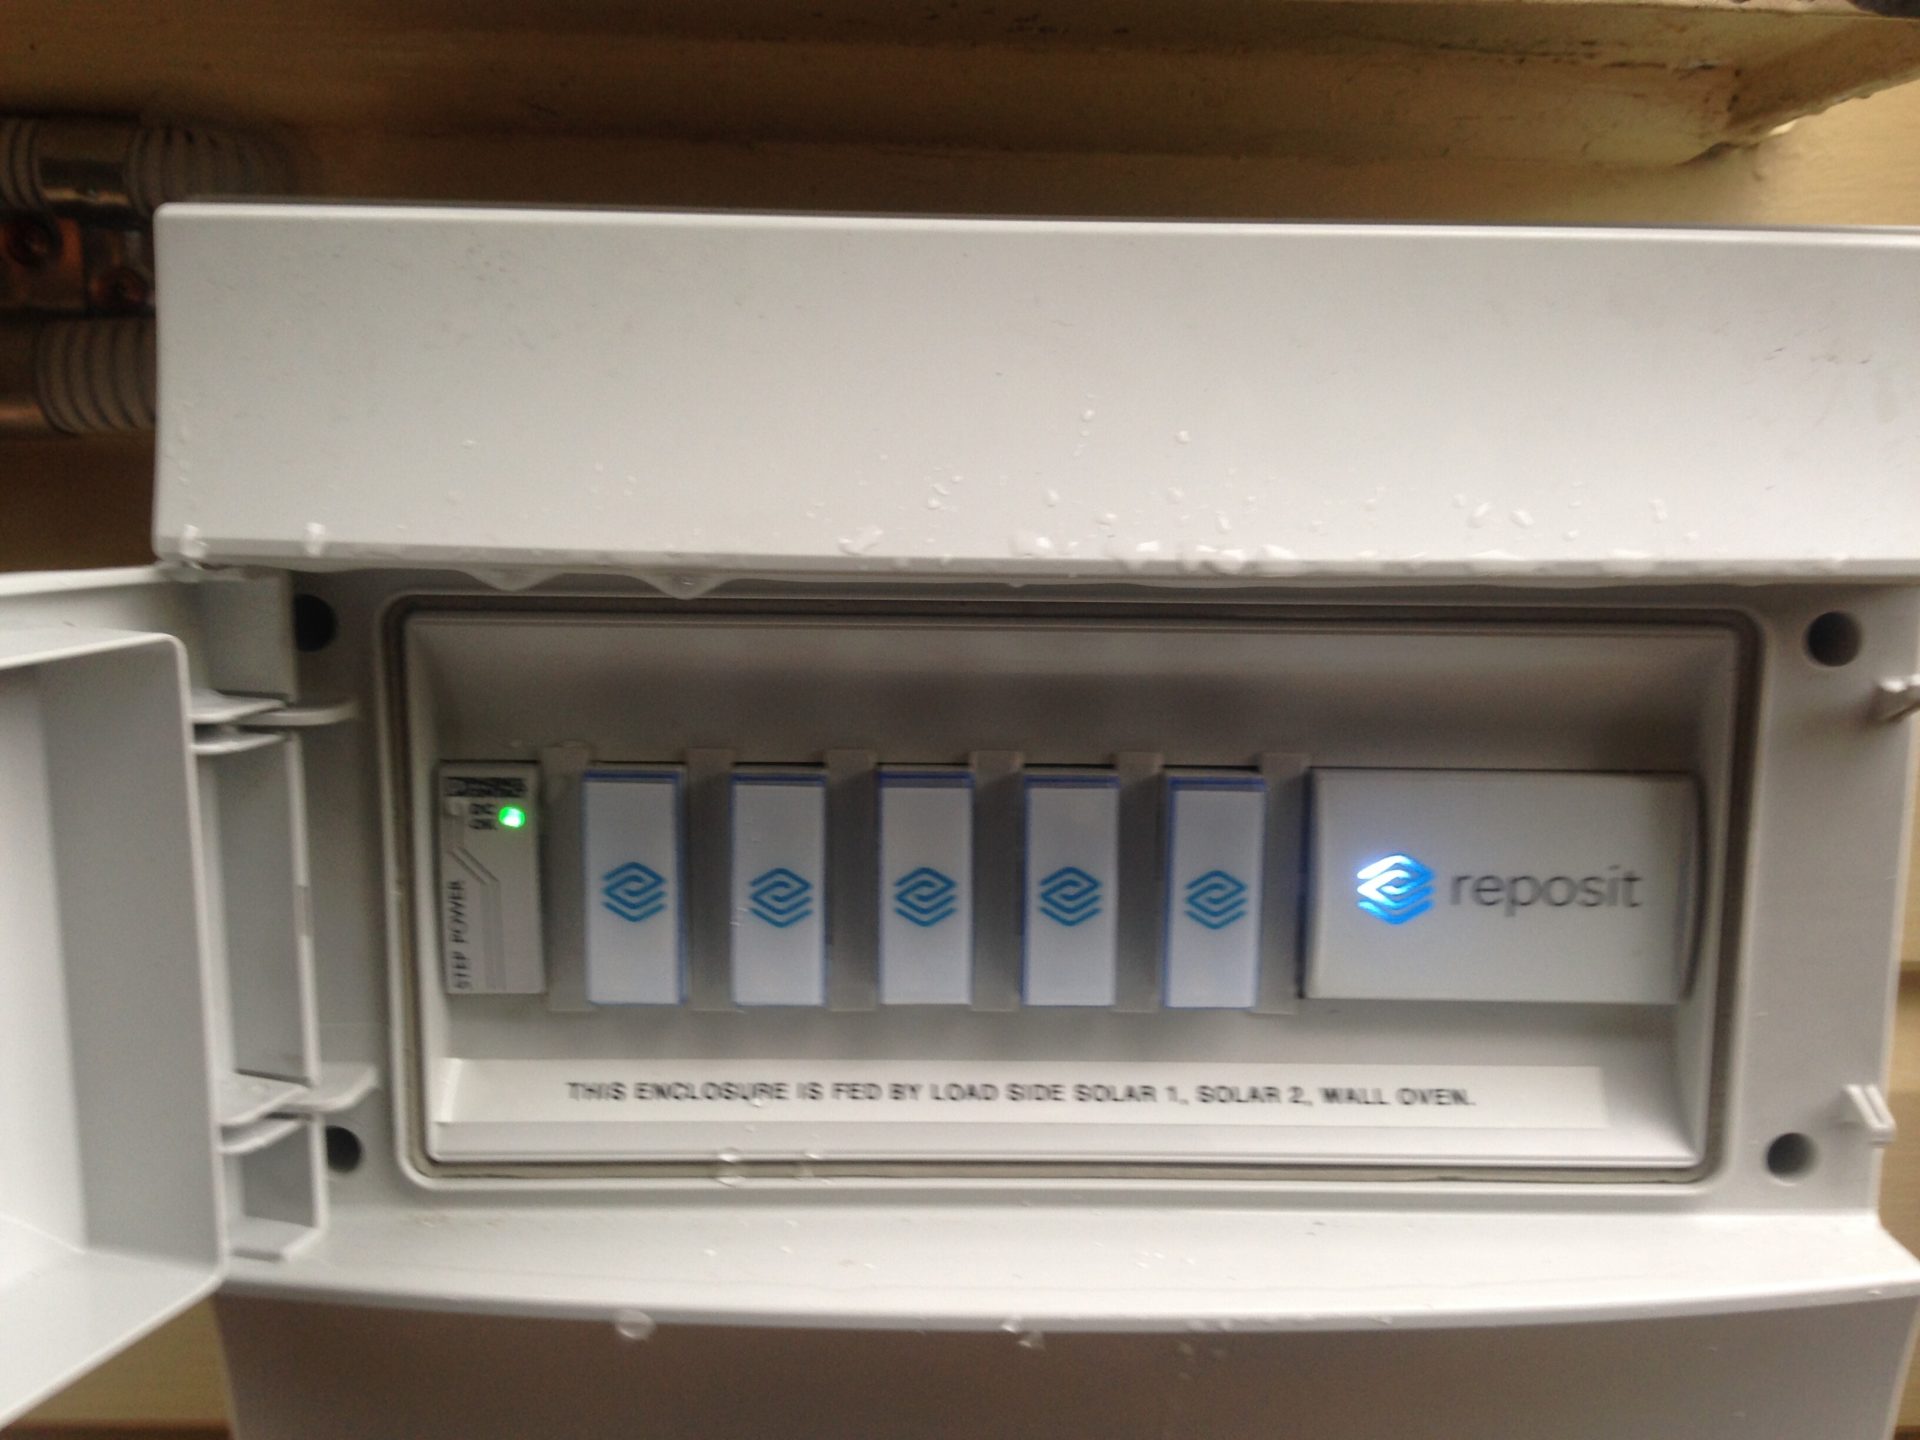
Reposit Box installed in a dedicated enclosure (because there was no room in my meter box).
How does it connect?
Access to the data logged by Reposit First is transferred into the company’s cloud software via a WiFi connection. In other words, the Reposit Box connects to your WiFi router (either by a physical ethernet cable or wirelessly) and uses that connection to send your energy data back to Reposit’s servers so that it can be formatted and displayed on your Reposit smartphone app or web portal.
WiFi is a cost-effective way to connect a home energy management system (as most households already have a WiFi connection in place), but has the slightly inconvenient downside of being (generally) less reliable than a mobile/3G connection. For example, if you lose power or internet connection, you also lose access to recent data on the Reposit app (from the time of the outage until the connection is restored).
In the early days of my Reposit First userdom, I noticed that from time to time my connection would drop out, and I wouldn’t be able to see real time energy data (my favourite feature) in Reposit app or web portal. These events – though relatively infrequent – would sometimes last in excess of 12 hours, and there was no clear rhyme or reason to their happening. Once back online, however, all the historic data was instantly restored.
When I brought this up to Reposit’s service team, their response was that I needed to either move my WiFi router closer to the Reposit Box, or hard-wire the connection with an ethernet cable. Since I’ve got a 3 year old who loves to poke at anything that has lights and buttons (and is also interested in cables of all shapes & sizes), we keep our WiFi router high out of reach – and moving it wasn’t an option. Since installation I’ve experienced a handful of ‘blackouts’, but overall it hasn’t been a big issue.
What’s it capable of?
Reposit’s app & web portal are very intuitive and easy to use, providing on-demand insights into your historic, present (real-time) and estimated future energy consumption & solar production trends. Like the other monitoring platforms I’ve looked at, the layout and data displayed varies a bit between the web portal and app versions.
The short video below provides an overview of everything visible through the Reposit First smartphone app – including daily energy production, consumption and costs. (We go through each of these in detail in the sections below.) The app view is a bit more comprehensive and detailed – and has more explainer text – than the web portal view.
The next video is an overview of the web portal (desktop) view in Reposit First; this view contains much of the information the information visible in the app, but condensed into a single screen.
Dashboard
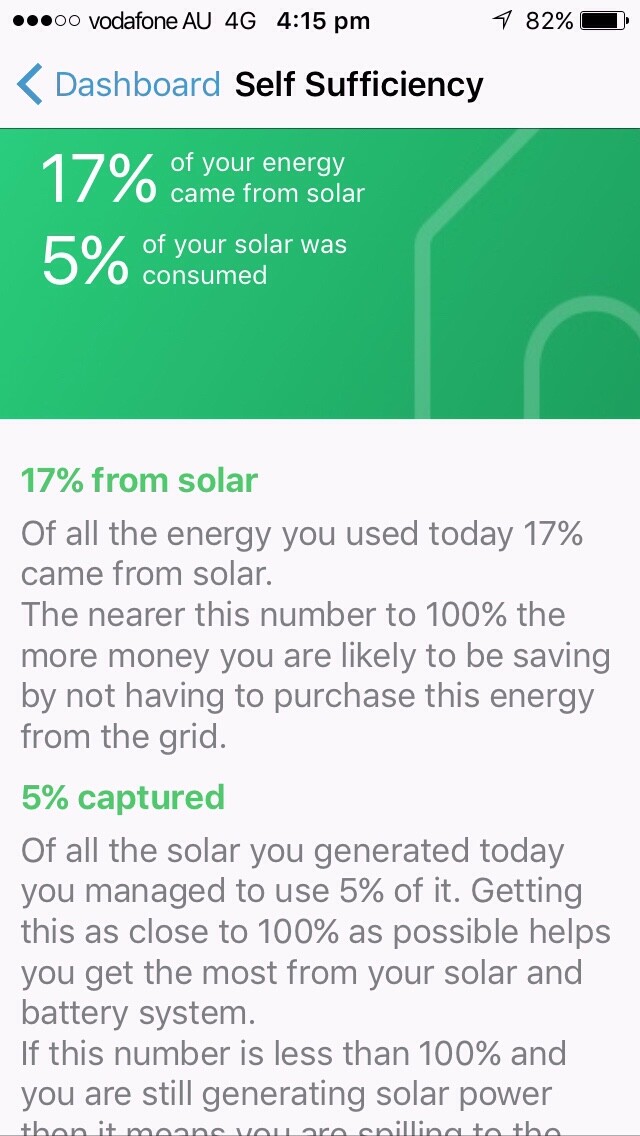
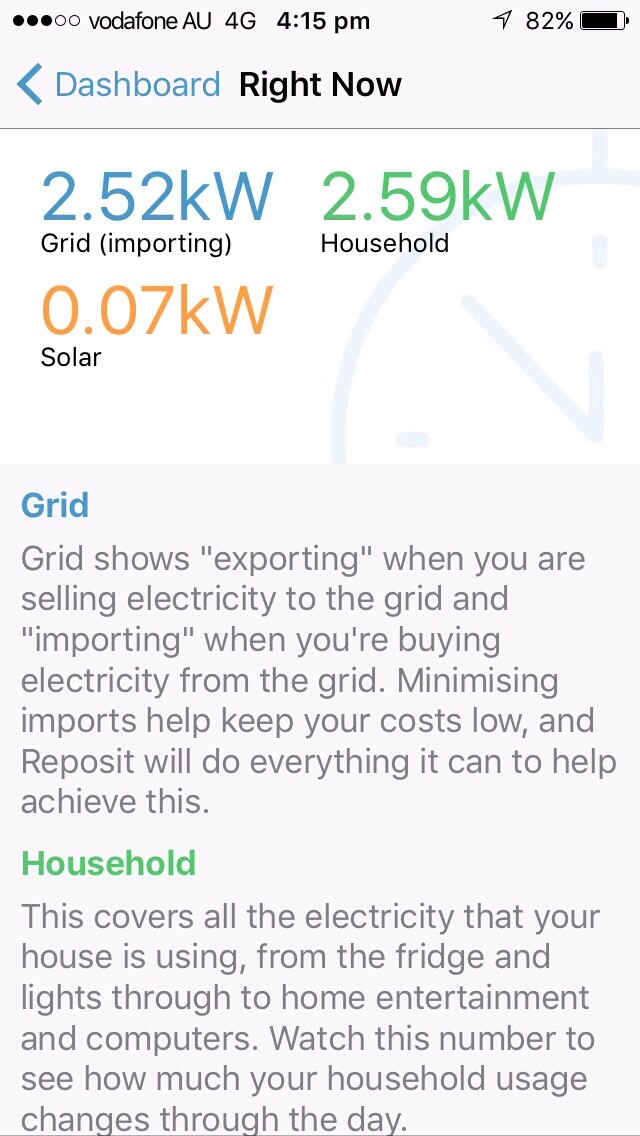
When you first open up the Reposit app, you’ll get a breakdown of the main things you need to now about your energy use for the day: Estimated costs (not including any controlled load charges), self-sufficiency (how much of your locally-produced energy you’ve managed to use), and info on what’s happening ‘right now’ in your home. Tapping on each of these brings up more detailed information, as well as explainer text about what these figures mean.
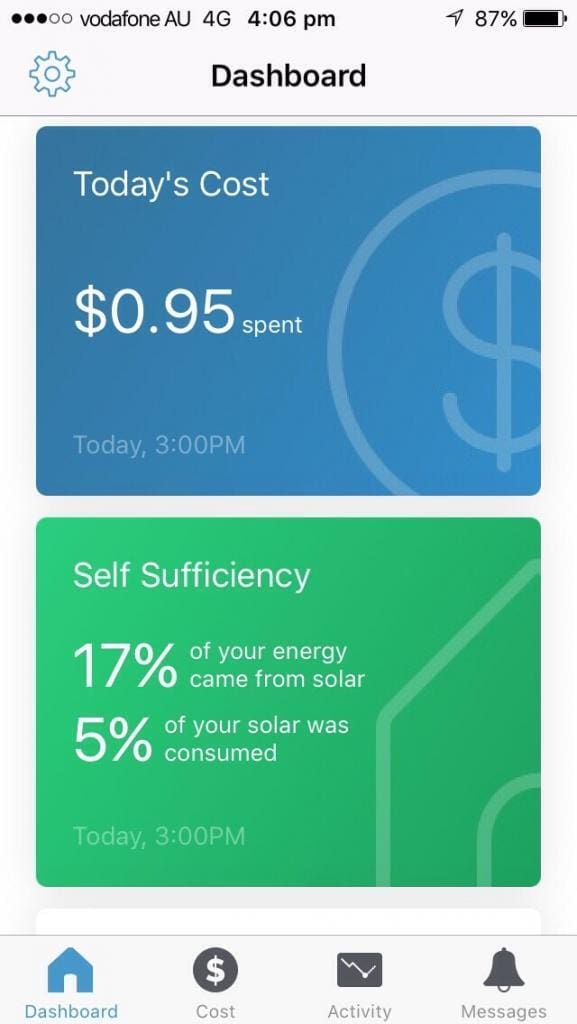
The home/dashboard screen in the Reposit app (above) and a gallery of the ‘more info’ sections that you can access by tapping them (below).
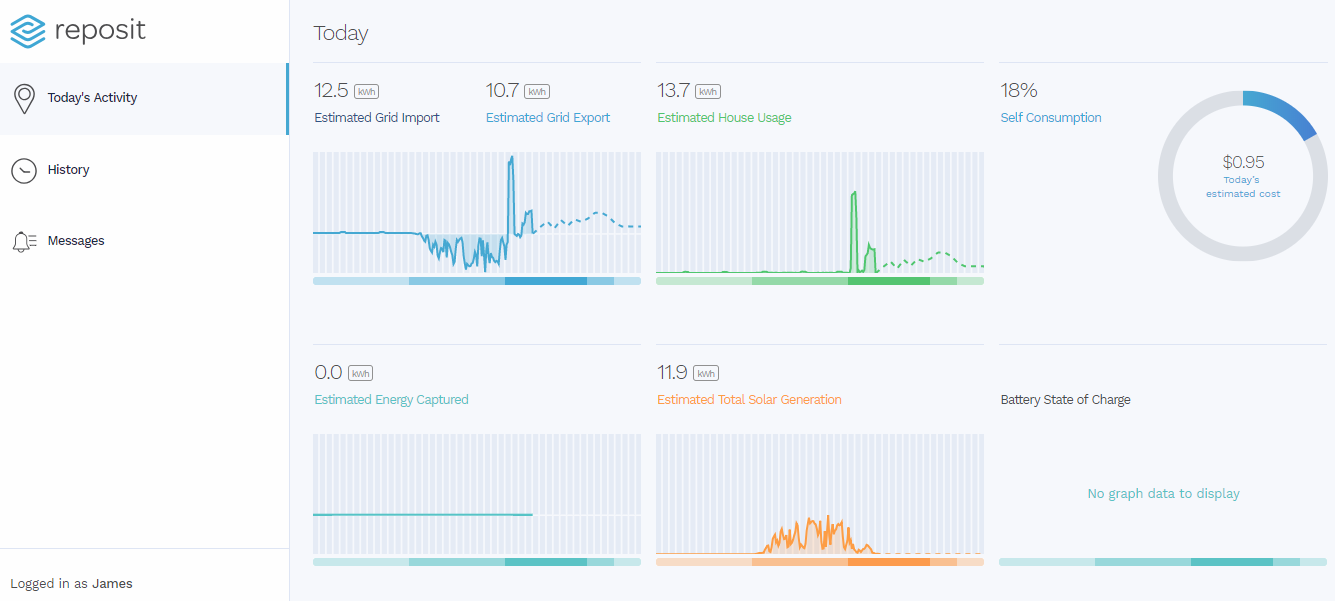
Meanwhile, the desktop view contains the same line graphs as the app, but with fewer view options. If you’re looking at the current day, you’ll see figures estimating how much your cost for the day will be, as well as how many kilowatt-hours (kWh) you’re likely to use based on your personal historic trends. If you look at previous days, you’ll see the actual totals.
The first graph shows grid import/export in one place; a dip below the horizontal line at the bottom indicates that the home’s energy needs are being met directly by solar and/or batteries, while excursions above the line show that energy is being draw from the grid. There’s also a graph for household energy usage (regardless of whether it is supplied by solar, batteries or grid) and one for solar energy production. For households without a battery bank (like mine), the last two graphs – Estimated Energy Captured (by your battery) & Battery State of Charge – are blank.
Cost
One of the main reasons for someone to get an energy monitoring system is to understand how much they are spending on energy and why. Reposit First does an amazing job of making cost data easy to access, delve into, interpret and act upon. Reposit even goes so far as to upload your electricity bill info into your settings at the time of setup, and will continually do so throughout the life of your subscription as part of a ‘managed service’, so that you know that the price data you see in their app is always up-to-date and accurate. (Noting that any controlled load charges are excluded from the graphs & tallies.)
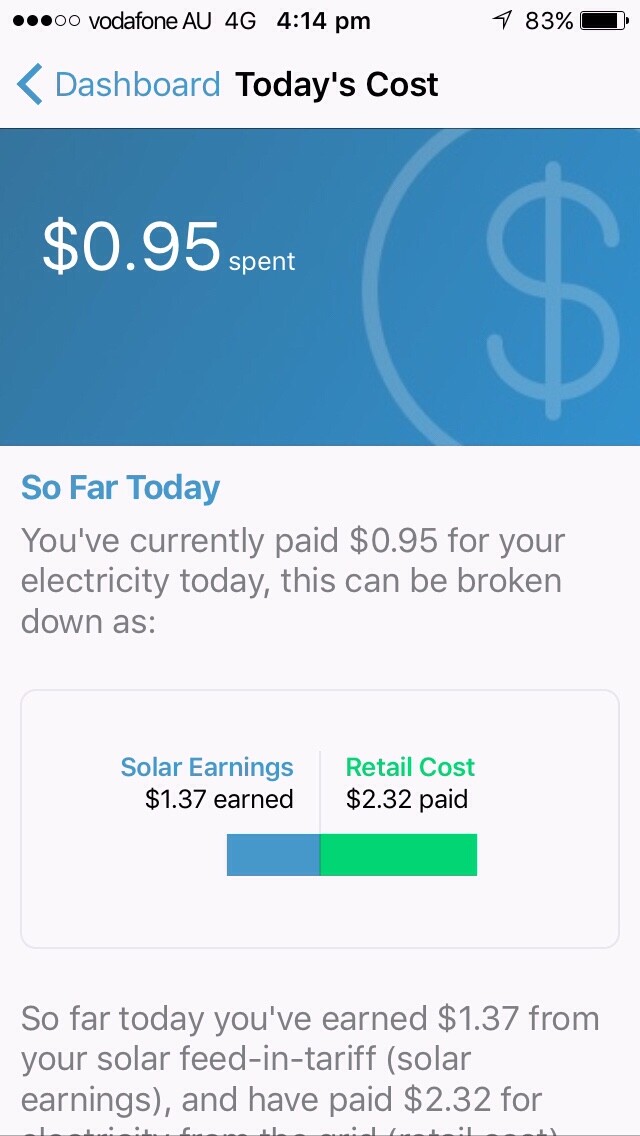
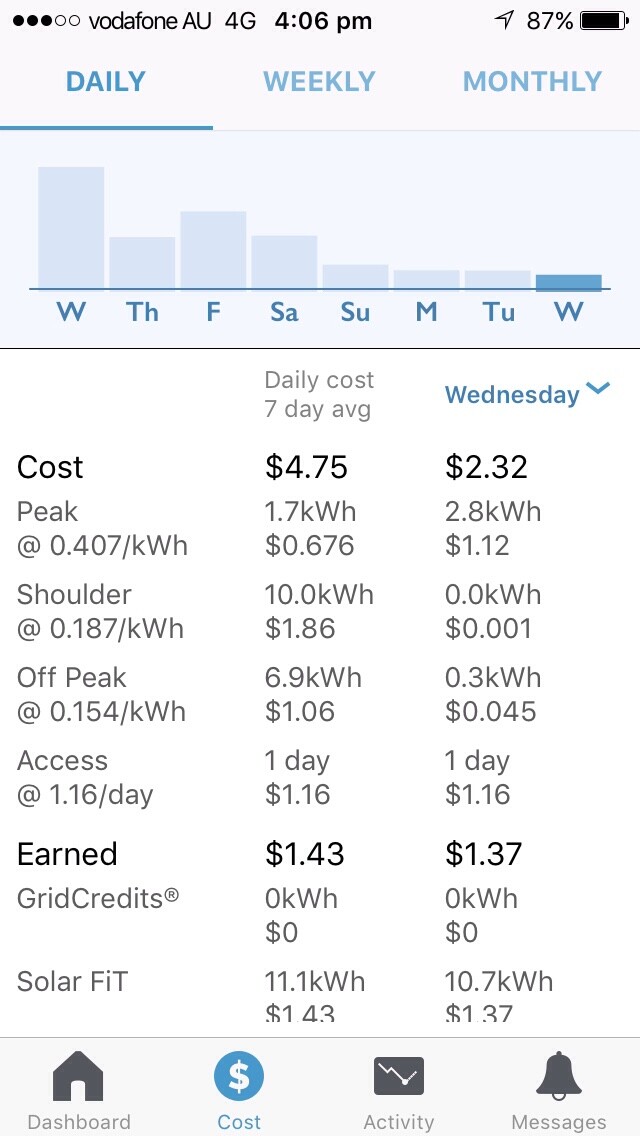
The ‘Costs’ tab in the app gives you a clear picture of how much you’ve spent for the day and how much you’re spending on average across the last few days, weeks or months. You can tap on the different days (or weeks, or months) to see more detail about the net total amount spent, with a simple breakdown of the ‘cost’ (i.e. purhcase from the grid) and amount ‘earned’ (i.e. from solar feed-in credits or GridCredits) just below.
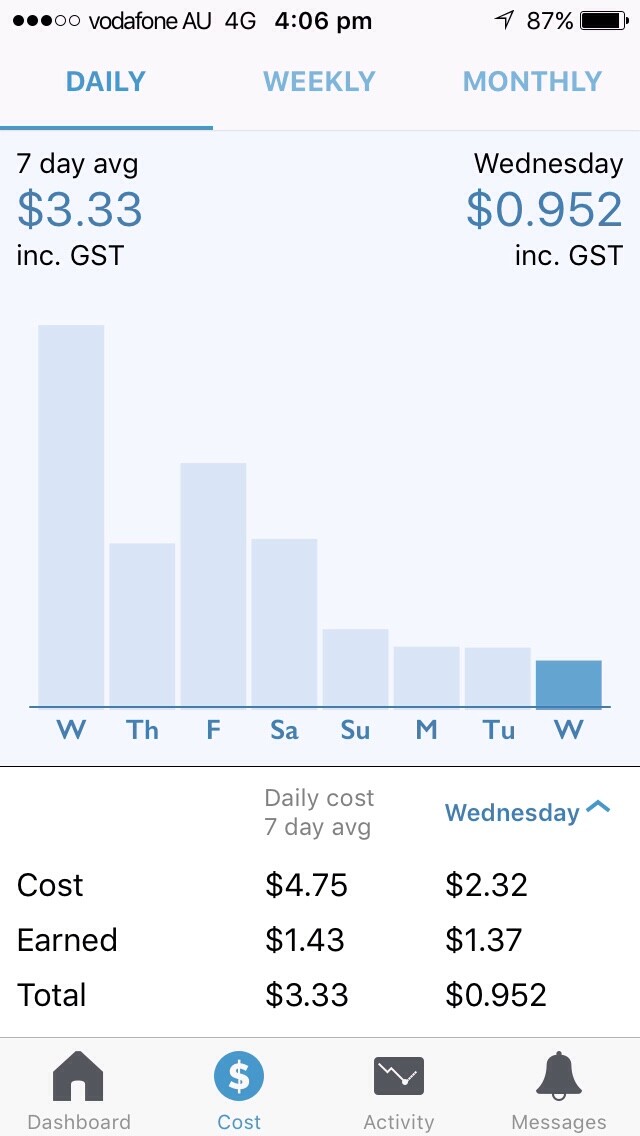
By tapping below the graph, you can expand the ‘Cost’ and ‘Earned’ sections to see further detail. This is especially useful if you’re on time of use billing (as I am), where your rates are higher or lower depending on the time of day that you draw energy from the grid, as it allows you to see how much you’re spending during the most expensive times of day as opposed to cheaper off-peak period. The expanded ‘Earned’ section shows the credit amounts accrued through solar feed-in and GridCredits (the latter of which are zero for me, as I haven’t got batteries).
One of the best features of the desktop view is the monthly calendar cost breakdowns, which can be viewed by clicking the ‘History’ button on the left of the screen. Doing so brings up total costs for the current and previous months (June has been a relatively costly month for my home!) as well as detailed daily cost overviews, so you can easily identify the most and least expensive days. Clicking on one of these dates will bring up the charts and energy consumption totals for that day for further scrutiny.
The screenshot below shows how I was able to select my most expensive day for June so far (at $10.14 in total, after feed-in credits) and endeavour to work out what happened. (It seems it was a combination of use of my dinosaur air-conditioning unit and inclement weather that resulted in poor solar energy production.)
You’ll also note that the bar below the graphs colour-codes the expensiveness of electricity for that day (light to dark) in accordance with my off-peak, shoulder & peak time of use rates.
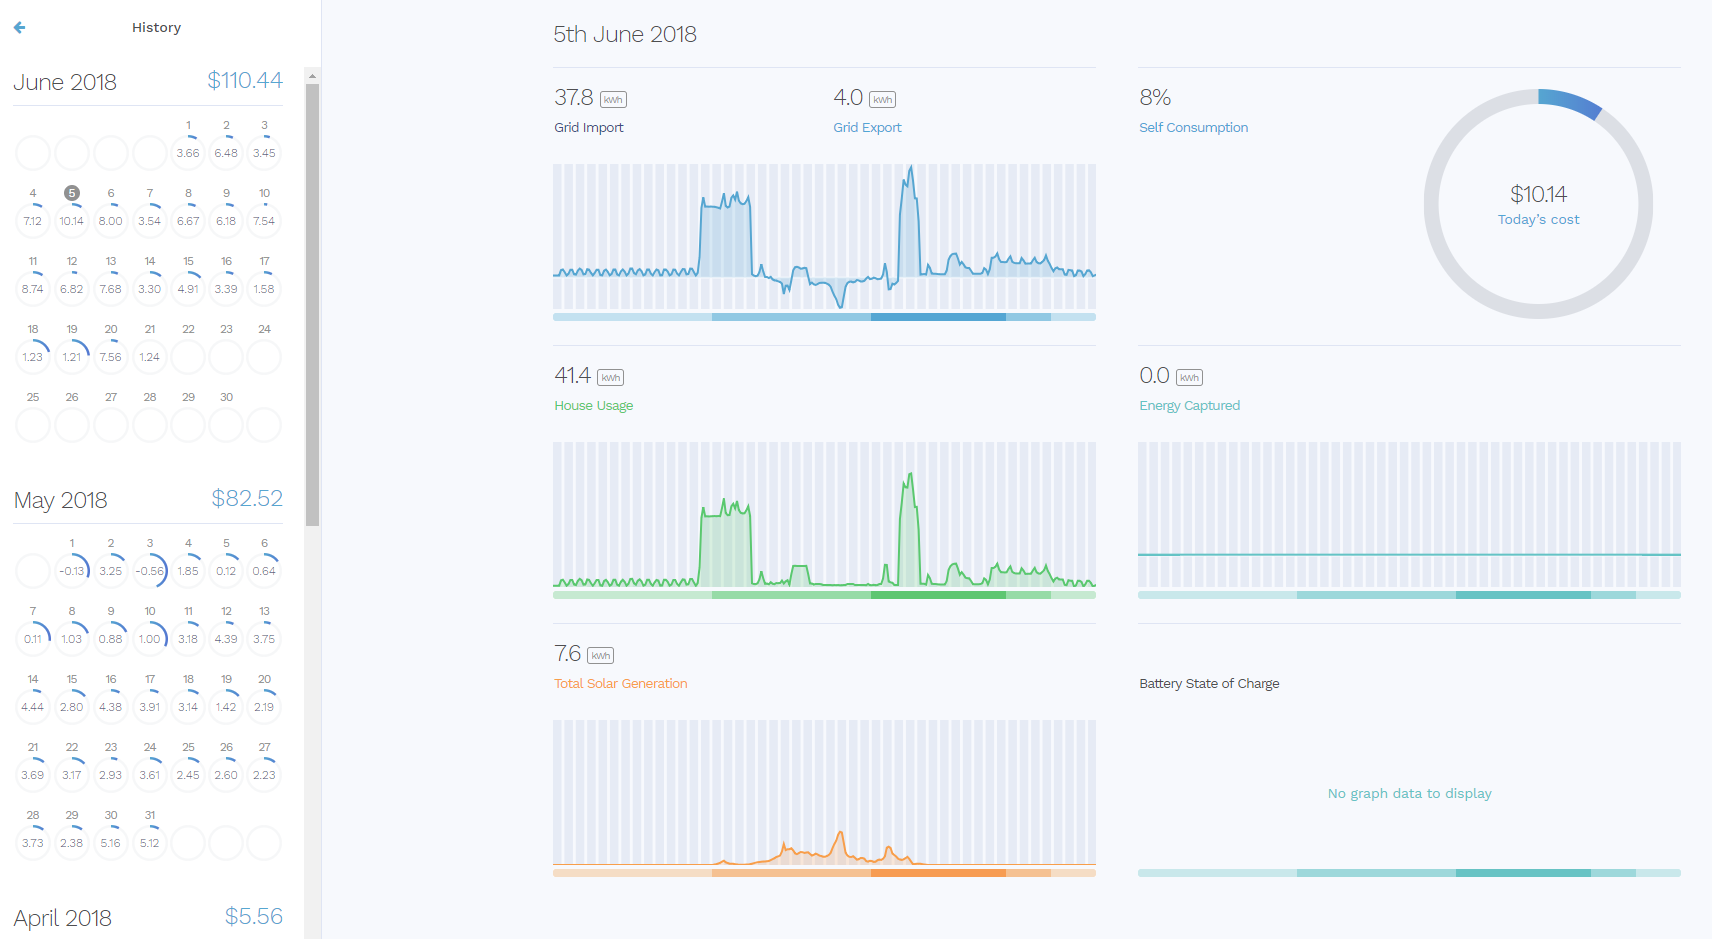
Screenshot from the Reposit desktop browser view illustrating how I was able to easily identify my most expensive day for June, then zoom in on my energy consumption/production details for that day.
Activity
The ‘Activity’ tab on the Reposit app contains two views – ‘Flow’ and ‘Graph’. Flow shows – as you might guess – energy flows through the house – including energy consumption, solar production and energy to and from your battery (if you’ve got one).
Flow view
The real-time energy monitoring Flow view is my favourite and most-used feature in the Reposit app. Updated every few seconds, it reflects what is happening with energy in your home right now, allowing you to work out how much power various devices in your home require to run (if you switch something on, you’ll see your consumption increase immediately). The simple graphics mean that you don’t need an instruction manual to understand exactly what’s going on in the first few seconds.
Down at the bottom there are three buttons to toggle between – ‘Now’ for real-time (as described above), ‘Last hour’ (self-explanatory) and ‘Today’ (the total so far for the day). If you go to any previous dates, you’ll only see the total for the day.
Graph view
The Activity/Graph view on the app is very similar to the Dashboard view on the web browser portal. It shows kilowatt (kW) consumption/generation in the line graphs, as well as total (or total estimated) kWh figures for each graph for that day at the top of each graph.
Tapping ‘Tariffs’ at the bottom changes the view to highlight your time of use billing schedule (if you’re on one), thus enabling you to see at a glance how much energy you’re using during expensive peak times vs less expensive shoulder & off-peak times.
Activity/Graph view: Grid Import/Export, House Usage & Solar Generation. Tapping ‘tariffs’ at the bottom reveals your time of use billing schedule (if you’re on one).
Messages
Reposit’s app & web portal both have a section for ‘Messages’, but it seems that these aren’t particularly relevant for homes without batteries, as I haven’t received a single on over the past few months. My understanding is that these tend to pop up mainly for GridCredit events (when the homes can earn extra money by exporting stored energy into the grid).

I have no messages!
Reports
At present, there is no report export functionality built into Reposit interface as there is with Solar Analytics and carbonTRACK, but users can export their data by going to api.repositpower.com.au/login and logging in with their regular Reposit credentials.
The fact that there’s a separate login for reports may not be particularly important for many energy management system owners, but it’s worth mentioning that this is one of the key differences between Reposit and the two others that I have direct experience with.
How about adding batteries?
Households who eventually add (Reposit-compatible) batteries unlock another, even more sophisticated level of Reposit’s functionality, with the company’s software and algorithms becoming a proactive management system that helps maximise the value you get from your battery bank. This is Reposit’s claim to fame as well as its strong suit.
Despite the data that Reposit would have about a customer’s energy usage habits and the algorithmic computing power that they’ve evidently got behind their technology, there’s no obvious, direct way (e.g. a built-in calculator or estimator) that Reposit’s software can assist a household in determining the best battery system size without the homeowner doing some back-of-envelope calculations (or getting some estimations from a reputable solar company).
That being said, it’s not unthinkable that they could introduce such a feature at some point in the future, as the features on their app can be updated remotely (there’s already been one update since I started using Reposit.)
How much does it cost?
Reposit First retails for around $600-$1,200, depending on the number of phases in the home and on whether it is included as part of a brand new solar (and battery) system, or as a retrofit to an existing system.
Because Reposit connects via WiFi, there are no ongoing subscription costs for users (besides your usual internet bill).
Warranty
Reposit comes with a standard 5-year warranty covering complete replacement of the device (including labour).
What about energy management?
Reposit is capable of managing & optimising the way that energy goes in and out of a battery bank (if you have one).
At the time of writing, Reposit does not have any remote control functionality allowing users to, for example, turn devices or circuits on and off remotely (via the app). As Reposit First is a product focussed on homes without batteries, it is purely a monitoring system (unless/until batteries are added on).
Update: Soon after I published this article, I was informed by Reposit that they will be announcing/introducing device management functionality (through ‘If This Then That’ IFTTT) in the coming days. While every Reposit unit currently installed already has the hardware for this functionality built-in (i.e. every Reposit Box can potentially ‘do’ management), the first tranche of functions will be available only to battery system owners. Reposit First/non-battery customers can look forward to certain control functions being introduced in August this year.
The video below explains how Reposit intelligently manages the charging & discharging of batteries to maximise savings.
In short
Reposit First is an simple-to-understand yet surprisingly comprehensive energy monitoring system that is fun to use. Furthermore, coming from an Australian company that specialises in software & technology for grid-connect battery storage, Reposit First is also an ideal gateway into smart battery ownership. With installation prices starting at about $600, it’s not an insignificant expense for a household, but given its unique points (e.g. GridCredits) is almost certainly worthwhile if you’re thinking about or planning on getting a battery system for your home.
You can learn more about Reposit’s monitoring & battery control system at www.repositpower.com.

He is now the communications manager for energy technology startup SwitchDin, but remains an occasional contributor to the Solar Choice blog.
James lives in Newcastle in a house with a weird solar system.
- Solar Power Wagga Wagga, NSW – Compare outputs, returns and installers - 13 March, 2025
- Monocrystalline vs Polycrystalline Solar Panels: Busting Myths - 11 November, 2024
- Solar Hot Water System: Everything You Need to Know - 27 February, 2024
Reposit seems like a fairly standard monitoring system, but in your last paragraph you mention their unique feature (Grid Credits) but don’t discuss it. How much are GridCredits really worth? My back-of-the-envelope calculations would suggest “not much” and certainly not enough to justify any significant investment. Any comments?
Hi Tony,
Under the Reposit/PowerShop Grid Impact plan, GridCredits are worth between
$80-$1,000(my mistake – edited) $20-$250 annually – with the highest rates in Victoria. Under the Diamond Energy GridCredits plan, it’s less clear, as GridCredits are uncapped but only paid out during high price events – but I wouldn’t venture that it’s a huge amount (discussed in this article about selective energy export).In the end, Reposit is likely to work best for households with batteries not purely because of GridCredits but also because it optimises battery charging/discharging (which will account more savings throughout the year, although it’s unclear to me how much).
In the end, I think that the people who opt to have Reposit installed will do so for more than just financial reasons.
And yes – there are plenty of other energy monitoring & management systems out there!