I am very happy to announce that I’ve finally got the first of three energy management/monitoring systems for my home up and fully functioning. Reposit Power have sent one of their ‘Reposit First’ units my way; it was professionally installed in about 2 hours on Monday this week.
(Although my carbonTRACK system is fully installed, there’s a technical glitch that we’re trying to get to the bottom of – namely: my electrician might have accidentally yanked one of their monitoring clamps so it’s not reading properly. Plus, what I want to do with my hot water is a bit complicated. More on this to come in a later blog post!)
Although Reposit is most well known for their battery-related stuff – namely GridCredits – they’ve also branched out into providing general energy monitoring services. Hence ‘First’ in the name of the product I’ve just had put in – you can have it installed even if battery storage is still nothing more than a distant dream for you.
I will be writing up a proper review of their system in the near future, but for now I wanted to share some of the cool data stuff that their system lets me do/see, in bulletpoint format.
Real-time energy consumption & production data
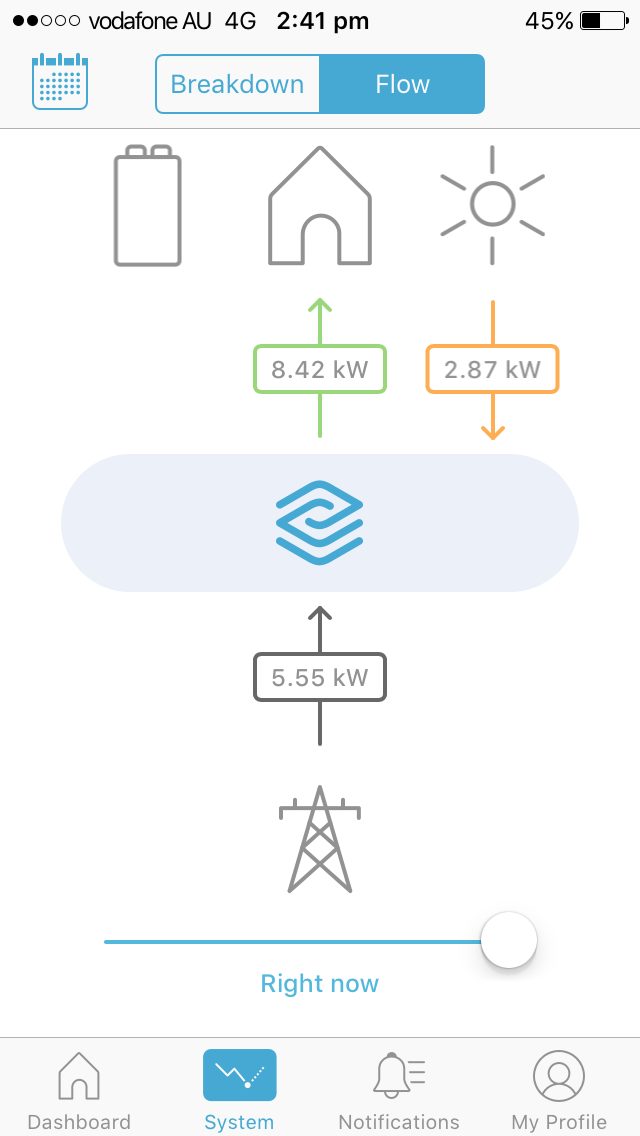
If you open up the Reposit First app, you can see exactly how much energy your home is using and where it’s coming from (e.g. solar, battery or grid) – in real time. I don’t have batteries, but the app makes it clear to me with the little battery icon place holder that if I should get them in the future, it will have no problem monitoring their behaviour.
You’ll also note below that we’re drawing a pretty massive amount of power – this was Wednesday when it was 36 degrees in Newcastle. I wasn’t home but knew that our monstrous 3-phase AC unit was cranking just by opening up the app.

Daily overview of energy activity & costs
How much did you pay for electricity today? Yesterday?
If you’ve got solar, how much of it did you self-consume as opposed to exporting to the grid?
Until the other day, I wouldn’t have been able to answer those questions either – but now I can.
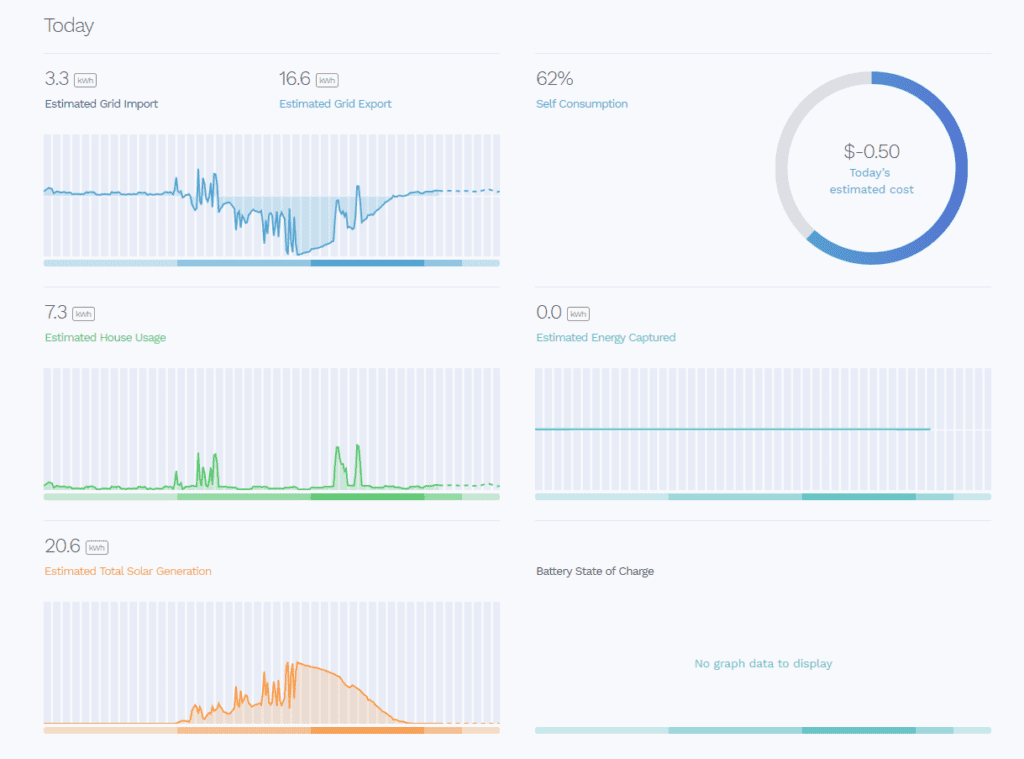
Today my electricity charges were actually negative (thanks to low use for the day and a fair amount of solar feed-in credit).
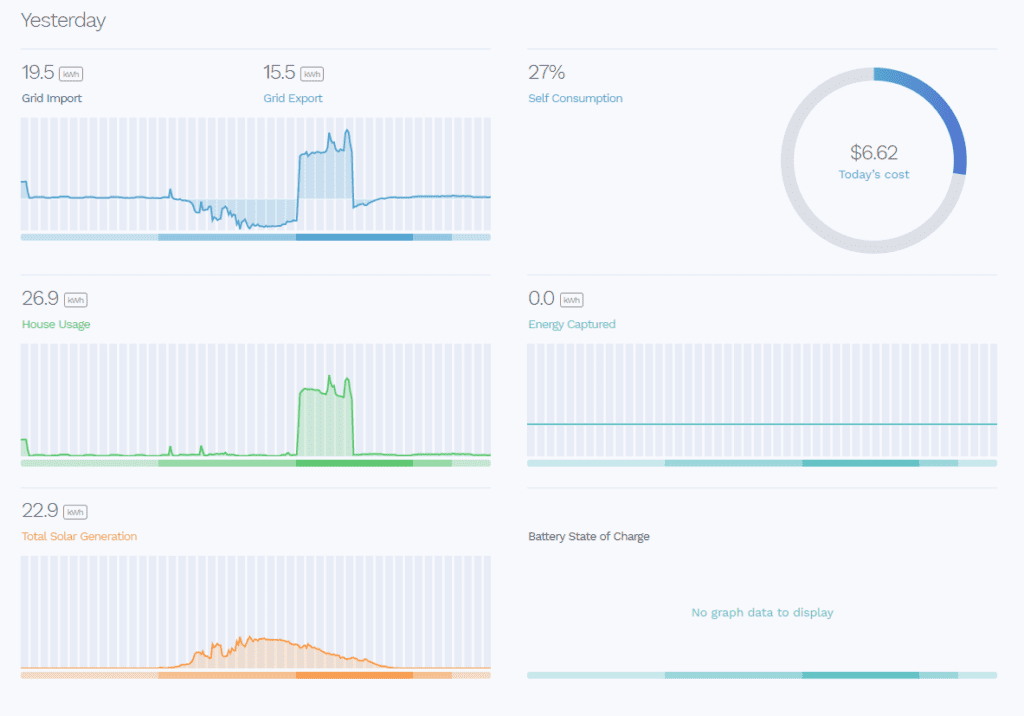
Yesterday, on the other hand, my net expense was $6.62 due to the AC running for several hours during peak time.
Today:
Yesterday:
Monthly overview in calendar format
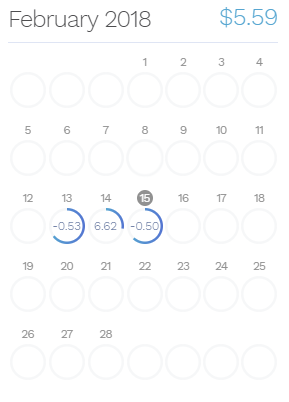
I already know what I’m on track to pay for electricity for the month since Reposit started logging my data (about $5.59 so far), and can see the final totals for each individual day using the calendar view on their web portal.
As a bonus, I can also see how much of my energy needs were met with the solar energy I produced (the blue part-circles, where a full ring would represent 100% of energy needs met by solar).

More details to come
I’ve got a lot more to say about Reposit First, but I’m going to save it until I’ve had a week or two of experience with it under my belt before I put pen to paper. Watch this space.
Join our mailing list to follow along
Get a free, instant solar & battery quote comparison
Compare Solar & Battery Quotes
- Solar Power Wagga Wagga, NSW – Compare outputs, returns and installers - 13 March, 2025
- Monocrystalline vs Polycrystalline Solar Panels: Busting Myths - 11 November, 2024
- Solar Hot Water System: Everything You Need to Know - 27 February, 2024

