Many of us in the solar industry and PV system owners have long awaited the day when the cost of home solar batteries drops enough to offer a reasonable financial return.
Solar Choice regularly updates this article to provide a scientific view of “Are we there yet?”. Since our first analysis back in February 2017, we have modified our solar & battery calculators, assumptions and methodology to reflect the changes in the solar battery storage market.
The article explores solar batteries for residential homes, examining if they’re worth the investment through scientific analysis and real-life examples. It breaks down how these batteries function, advantages such as lower energy bills, reliability during blackouts, battery prices, and available government rebates.
In short, the answer is that solar batteries are now financially viable in many cases with the inclusion of the national battery rebate announced in 2025. The time it takes to recoup the investment cost of your battery (payback period) has reduced from over 10 years to 8 years in our typical scenario outline below.
For those technically minded – see our more detailed analysis with 24 case examples here.
Solar Choice updates battery prices regularly, ensuring consumers get the latest insights for popular brands. Below is an updated table showing the average installed costs of the top 10 solar battery models for May 2025 (excluding federal and state rebates):
Top 10 Solar Batteries and their costs in Australia
Solar battery prices depend on multiple factors, including:
Usable Capacity: The amount of energy a battery can store and provide during non-solar hours, typically measured in kilowatt-hours (kWh).
Installation Costs: The total cost of installation can vary case by case depending on things like your existing solar system, location of the battery and condition of your switchboard.
Retrofit or With New Solar System: Integrating a battery to an existing solar system usually costs more unless you installed ‘battery-ready’ system with a hybrid inverter.
What is a solar battery & how do they work?
Before we begin our solar battery cost analysis, let’s recap on how a solar battery works. Solar panels generate power during the day when the sun is shining. This power is used first to supply energy to any needs of the home and surplus energy is then typically exported back into the grid. Some energy retailers offer a solar ‘feed-in tariff’ to buy energy back from the customer.
As an alternative to exported energy back into the grid, the surplus power can be used to charge a battery. The home battery storage system can then be discharged in the evening to reduce the amount of power the homeowner needs to buy from the grid.
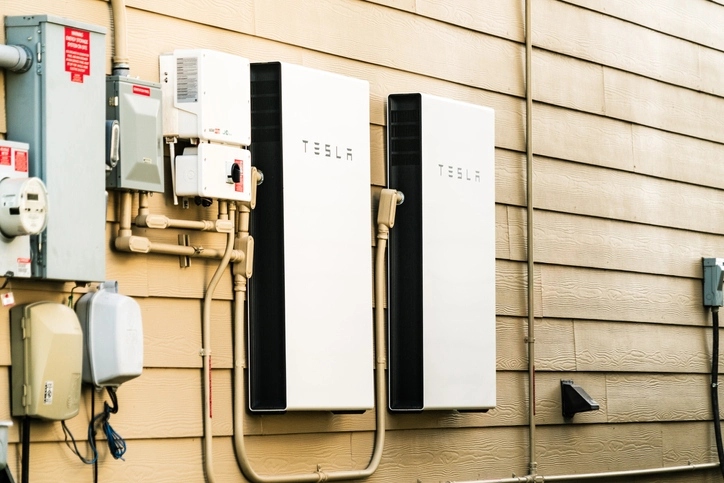
Solar power batteries store energy in DC. They can be connected via DC cables to a hybrid solar inverter. Some come with their own inverter built in (e.g. the Tesla Powerwall 3) and can therefore simply be connected to the main switchboard like any other AC appliance. Read more on AC and DC connections for solar battery storage.
Compare solar and battery quotes online now.
How do you benefit from a solar battery?
There are several ways in which a homeowner can benefit from connecting a solar battery to their solar panel system.
Saving on energy bills by reducing the amount of power you buy from the grid
The obvious one is the financial benefit of reducing the amount of power that you need to buy off the grid.
A typical residential solar system without a battery will cover about 30%-50% of household power consumption. With a solar battery, this can be increased to 80%, 90% or potentially even 100% of household power consumption.
When calculating your benefits, bear in mind that to charge a battery you have to forgo some solar feed-in tariff revenue. For example, if you charge a 10kWh battery during the day, that’s a 10kWh less feed-in tariff that you will see on your bill.
There will still be a benefit as you always pay a much higher rate to buy power than the rate that retailers are willing to buy it back from you.
Keep the lights on during a blackout
Blackouts can be highly frustrating and in some cases a risk to health. Different areas of the electrical network are more prone to receiving blackouts than others.
Most solar batteries on the market are now capable of keeping the lights on during a power outage. With some battery models, additional hardware is required to enable the battery to continue providing power during a blackout.
With the energy market closing due to soaring energy prices in mid-2022, for some Australians, we see a desire to increase their independence from the power network. Solar and batteries effectively take the majority of requirements and costs into your own hands.
Reduce your carbon footprint
Although we’ve made huge progress on the rollout of renewable energy infrastructure in Australia, the majority of the power generated on the grid is still from carbon-intensive, fossil fuel sources.
Installing solar panels is a great start to reducing your carbon footprint, but adding a solar battery will often more than double the reduction in your carbon footprint.
For participating homeowners, their solar battery may be discharged or charged by the VPP operator at times when they can make money on the wholesale or ancillary markets.
In exchange for this usage (which is often only a couple of times a year), the VPP operator will offer a benefit to the homeowner which might take the form of one of the below:
Bonus feed-in tariff (very high rate for power that is used)
Annual fixed fee for participating
A discount on the installation of the battery
How much do solar batteries cost?
Solar Choice has been tracking the average price of solar batteries in Australia across our database of over 200 solar installers in our Solar Battery Price Index since 2017. Residential solar batteries usually cost between $1,000 to $1,200 per kWh of capacity installed depending on brand, size and location.
The below table shows our current price index which excludes the federal and state-based rebates:
Average Solar Battery System Costs (Fully Installed) – May 2025
Battery Size
Battery Only Price*
Battery + Inverter/Charger**
3kWh
$4,140
$4,950
8kWh
$9,040
$10,240
13kWh
$13,650
$15,080
18kWh
$17,820
$19,260
* Battery only price is applicable if you are installing solar and batteries at the same time or have an existing solar system with a hybrid solar inverter
** This price is for retrofitting batteries to a solar system that has not allowed for a battery integration in the future which requires an additional inverter/charger to be installed along with the battery
Notes on Pricing:
Includes costs for wiring, other necessary components and installation
Excludes all rebates that are available
Compare solar and battery quotes online now.
Federal and State rebates for solar batteries
In early 2025 the Government introduced a $2.3bn national battery rebate program that will take effect from 1st July 2025. This rebate is administered through the existing STC rebate program and offers around $370 per kWh or roughly 30% off the cost of installing a solar battery.
This federal rebate can be combined with any state rebates that are available:
NSW
NSW have announced a battery the ‘NSW Government Solar Battery Rebate‘ scheme which became available on November 1st 2024. This offers you between $1,600 to $2,800 for eligible homes depending on the size of the battery.
Victoria
Solar Victoria offers a interest-free battery loan of up to $8,800. Eligibility criteria includes a means test, houses with at least 5kW of solar installed and for owner occupiers only.
ACT
In the ACT you can get an interest-free loan up to $15,000 to cover the cost of solar and battery systems. The eligibility criteria are quite broad and support the uptake of a range of climate-friendly products. [Now Closed]
QLD
Queensland’s battery booster program with rebates of $3,000 – $4,000 closed for new applications in May 2024. There has been no indication at this stage that there will be future rounds.
WA
The Western Australian Government has announced the WA Residential Battery Rebate Scheme, launching by 1 July 2025. Eligible households can access rebates of up to $7,500 and interest-free loans up to $10,000 for new, additional, or replacement battery systems. The rebate is not means-tested, but the loan is, and systems must be at least 5kWh and VPP-ready.
Solar battery ROI, savings and payback period
To demonstrate the potential returns of a solar battery we’ve put together a common scenario for a homeowner in Australia. We’ve used up-to-date prices for electricity and solar feed-in tariffs and used our proprietary model which simulates the outcome of the project on an hourly basis for the next 2 decades.
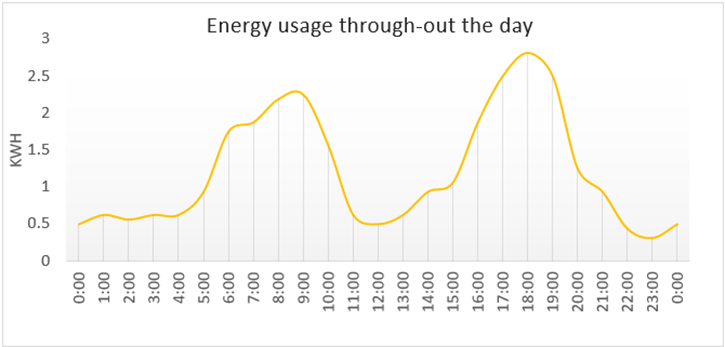
We have taken a typical scenario with peak energy usage in the morning and evening with a total energy usage per day of 20kWh. Energy rates were assumed to be a flat rate of 35 cents per kWh and a feed-in tariff of 5 cents per kWh.
Solar and Battery Solutions
We have analysed the impact of a 6.6kW solar system with a 10kWh solar battery on a household with 20kWh of daily usage following the profile in the above graph. Together the solar and battery system would cover 66% of the energy requirements of the house (increasing from 39% to 6.6kW of solar panels only).
The battery is recharged completely on 98.5% of the days. Given the high cost of batteries, we recommend including enough solar panels to reach at least an 80% battery utilisation.
Financial return
The below table shows that the solar side of the project has better financial return. In this general scenario, the 8 year payback period for the battery is on the cusp of being financial viable. Results will improve or decline depending on your state and your specific electricity tariff and consumption.
System
Cost
Annual Savings
IRR
Payback Period
6.6kW Solar & 10kWh battery
$12,680 (total)
Breakdown:
$5,080 (solar)
$7,600 (battery)
$2,197 (total)
Breakdown:
$1,093 (solar)
$908 (battery)
$196 (feed-in tariff)
19.9% (total)
Breakdown:
31% (solar)
13.5% (battery)
6.2 years (total)
Breakdown:
4.6 years (solar)
8.4 years (battery)
Assumptions:
Flat electricity rate of 35 cents per kWh and a feed-in tariff of 5 cents per kWh
Solar Battery Storage Payback Results by Australian city
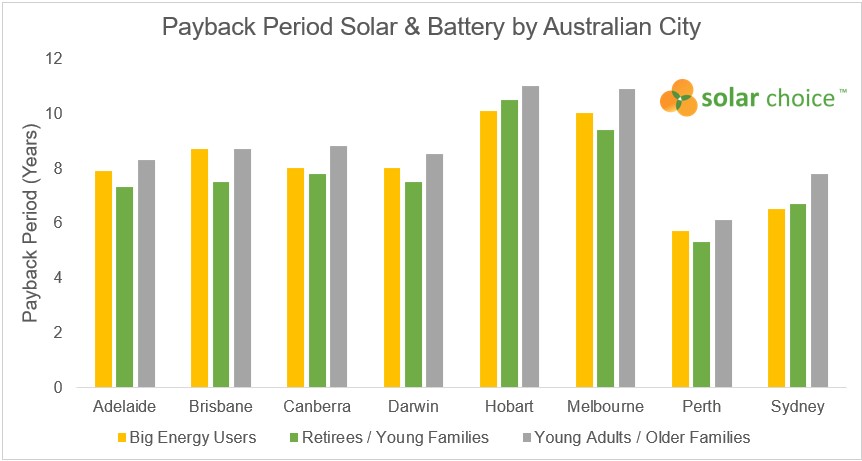
In our detailed solar battery study we assessed 24 scenarios including examining the different outcomes in each of Australia’s states and territories. As described in the graph below, solar batteries are most attractive in Perth and Sydney when comparing the payback periods.
Conclusion: Federal Rebate Makes Solar Batteries Financially Viable
We have been studying the financial outcomes of installing a solar battery in typical household scenarios since for over a decade. We believe the federal solar battery rebate will dramatically increase the take up of solar batteries in Australia as it pushes the financial case to be viable for many Australians.
Based on our calculations above, the base case for installing a typical residential solar battery (ignoring the benefits derived from solar panels) has a payback period of around 8 years. This can be improved if you are eligible for a state-based rebate, can join a Virtual Power Plant or have large energy consumption in peak tariff periods.
This financial return is supported by the non-financial rewards of installing a battery including the potential to have back-up power during an outage and reducing your carbon footprint.
Compare quotes from up to 7 pre-vetted installers in your area now. Since 2008 our knowledge and sophisticated software has allowed over 300,000 Australian households and businesses to make a well-informed choice on their solar & battery installer.
FAQs
How long does a solar battery last?
The bigger brands on the market like Tesla, LG and Sonnen, warranty their batteries for 10 years. This is a good indication of their expected life. During that time the solar batteries will also degrade and lose some of the storage capacity. After 10 years typically batteries would be expected to store 60% to 80% of their nameplate capacity.
What size solar battery do I need to power a house?
The answer to this question depends on how much energy the house consumes. If we take a typical example of a house that uses 30kWh per day in Sydney. If the owner has a 6.6kWh solar panel system with a 10kWh solar battery this would cover 66% of the energy with the remaining 34% drawn from the grid.
With a larger 10kW solar panel array with a 20kWh solar battery, we estimate that only 8% of the house’s power would be drawn from the grid.
What is the best solar battery in Australia?
The best solar battery depends on what you need, like how much you want to spend, how much power you need, how much space you have, and what your energy goals are. It also depends on the weather where you live and if there are any special deals or money-back offers.
How much does a solar battery cost?
There isn’t a single solar battery that’s best for everyone. The cost of residential solar batteries ranges from $1,000 to $1,200 per kWh of capacity installed. Based on this, the cost of a 10kWh battery could range from $10,000 to $12,000, excluding any potential rebates or incentives. This will be the same when determining the cost of a 5.2kw, a 6.6kW up and up to a 20kW battery.
How long will a solar battery last?
The solar batteries duration for powering a home depends on several factors, including the home’s energy consumption rate and whether the battery is being used alone or in conjunction with solar panels. Read more on battery capacity and the difference between kW vs kWh in solar and battery storage here .
Jeff has consulted on over 20MW of commercial solar projects, ranging from SMEs to ASX top 100 companies. Jeff has also provided independent advice to 100s of residential solar, battery and EV charging customers across every state in Australia. He holds an MBA from the Australian Graduate School of Management and is an expert in business strategy and financial analysis.