Without googling the answer, do you know what the capacity of the largest conventional power plant in Australia is?
I couldn’t, so I did google it – and now I can tell you that the answer is 3.25 gigawatts (GW). Unsurprisingly, it’s a coal plant: The Loy Yang Power Station in southeastern Victoria.
Loy Yang is actually two separate plants located in the same spot. Eraring Power Station in NSW – at 2.88GW and also coal – is the largest single plant.
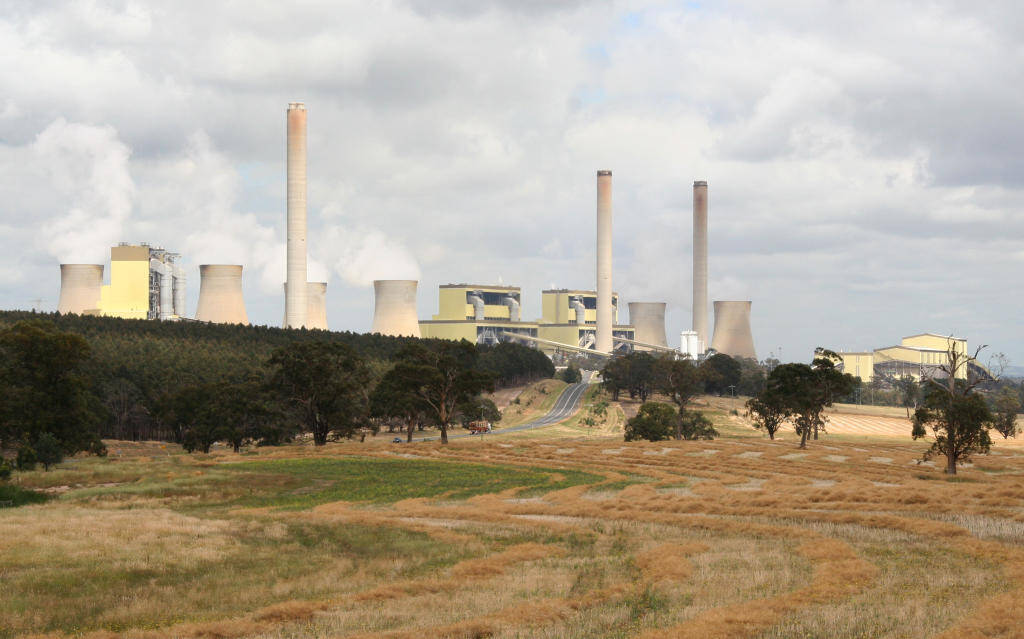
Loy Yang Power Station. By Marcus Wong, via Wikipedia.
Compare Solar & Battery Quotes
As the title of this article would have tipped you off, Australia’s small-scale solar capacity (under 100 kilowatts, kW) has just catapulted past the 6GW mark, thanks to a stellar August 2017 for the solar industry, with nearly 100 megawatts (MW) of new capacity having gone in. The big uptick in solar uptake was almost certainly a direct result of the news that grid electricity rates would skyrocket from July.
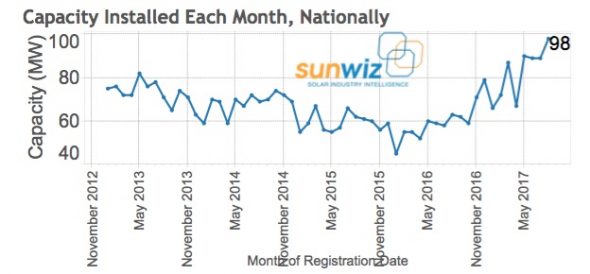
98MW of small-scale solar capacity installed in August of 2017 – one of the best months on record for Australia. Graph via Sunwiz.
To put these numbers into context, the standard size residential solar system these days is about 5kW. 1MW is equal to 1,000kW, so we’re talking about the equivalent of roughly 200x residential solar systems having gone in across the country in the course of a month. In reality, some of them were bigger and some smaller – but all of them were under 100kW.
(Sunwiz notes that Australia’s total solar PV capacity – including systems over 100kW – is now at about 6.5GW.)
1GW is equal to 1,000MW or 1,000,000kW (yes, a million kilowatts!) So 1GW works out to be the equivalent of about 200,000 standard residential system (noting that systems from a few years ago were on average a bit smaller, however).
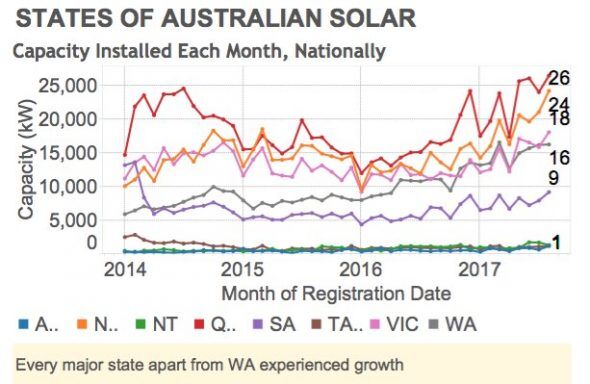
Queensland and New South Wales were the top two states, with 26MW and 24MW, respectively. Graph via Sunwiz.
One way to interpret these figures is to say that the 1MW of solar installed in August is roughly equivalent to about 3.3% of a large coal plant. That, however, would actually be wrong, as there’s a thing called ‘capacity factor’, which is essentially the percentage of the time that a power plant spends generating electricity at full capacity.
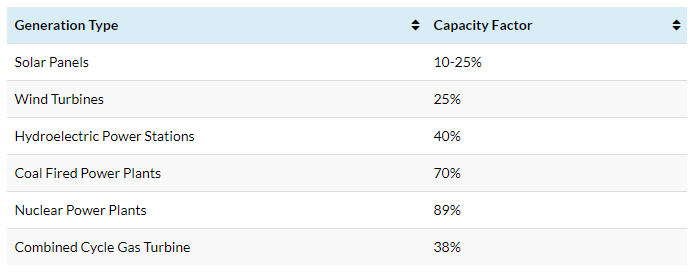
Capacity factor by generation type. Source: Sunmetrix.
Which is why – even after striking the 6.5GW mark – solar still makes up only a very small percentage (around 3%) of Australia’s generation capacity and energy production.
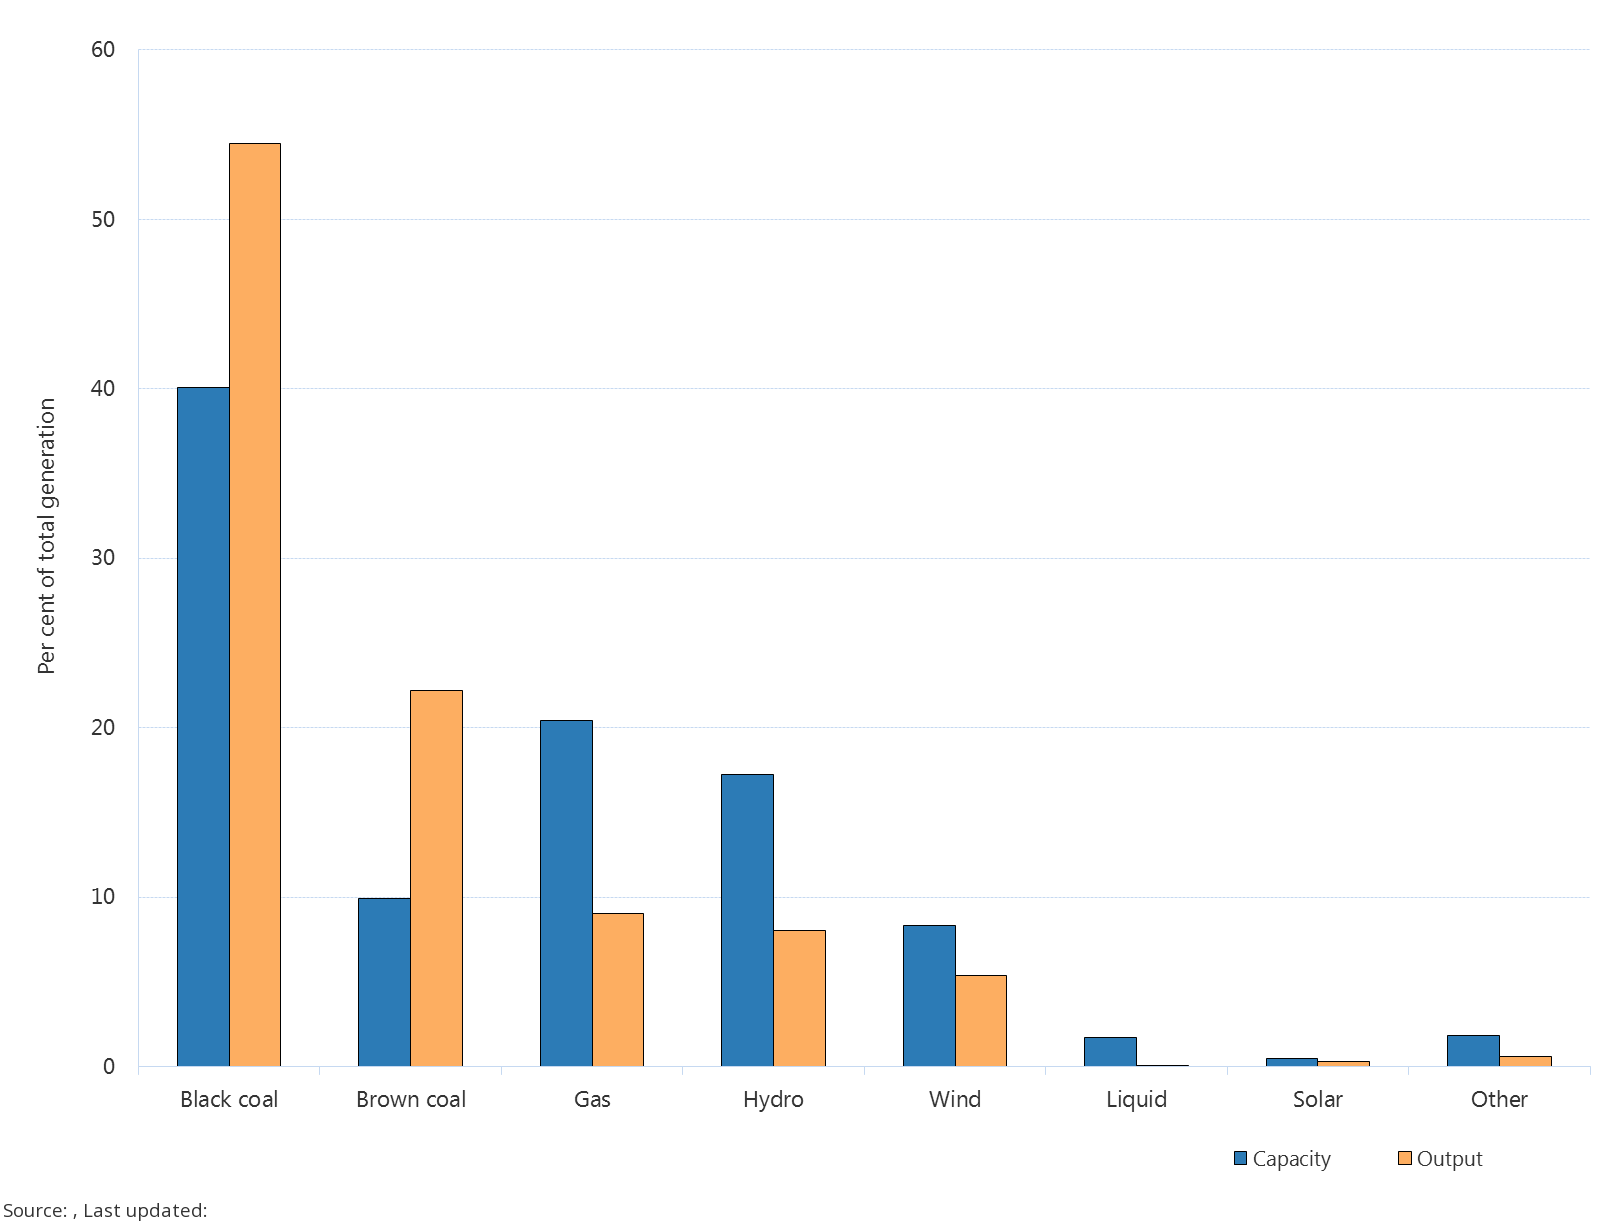
Electricity generation capacity & output by fuel type. Source: Australian Energy Regulator.
But not to fear, supporters of solar energy! A new report by DNV GL (the same people who brought us the Solar Panel Reliability Scorecard) indicates that it’s just the beginning for solar generation in Australia – and the world. By 2050, they predict, just under half the world’s generation capacity will be solar PV, and will account for just over a third of all electricity generated.
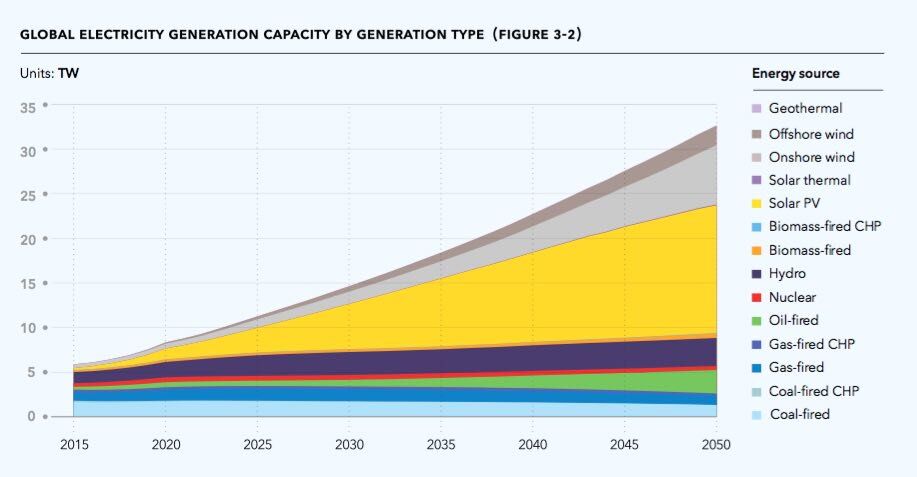
Global energy capacity capacity by type. Source: DNV GL.
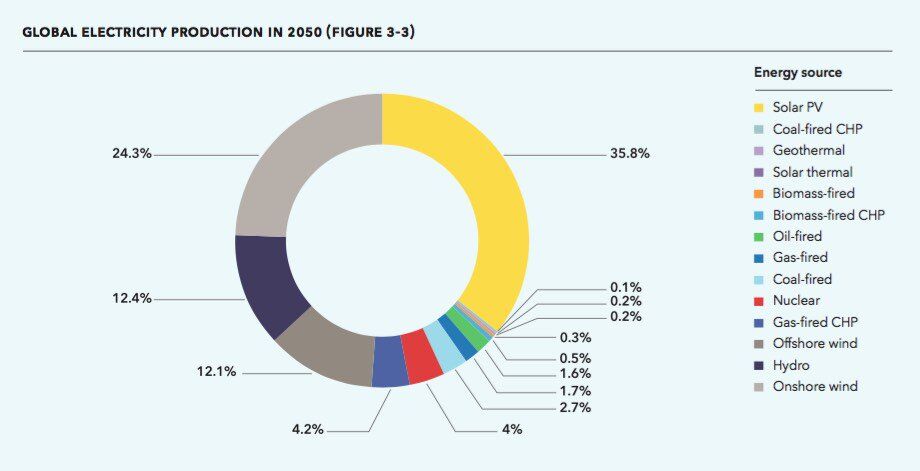
Global energy generation capacity by type. Source: DNV GL.
Compare Solar & Battery Quotes
© 2017 Solar Choice Pty Ltd

- The Top 5 Problems With Cheap Air Conditioning Quotes - 12 January, 2026
- Running Cost of Air Conditioners – Explained - 7 October, 2025
- Air Conditioner Rebate South Australia: What You Need to Know - 19 September, 2025
One additional factor not mentioned above is that the value of STCs went down noticeably (from approx $40 to $30AUD) in early-mid July 2017.
After a year and a half of research into solar and powerwall & other battery storage options, if I waited any longer then the reduction in STCs would have added approx $2-3k to my system’s installation costs.
Others would also have seen this coming and ordered their Solar with an average lead time of 6 weeks from quote/order to installation, occurring approx August.
I’m not saying this is the cause for all of the installations in Aug, but it was certainly a factor for me and surely others too, potentially resulting in a spike at the least.
Cheers,
Gavin