The question of whether batteries are worth it and affordable is long debated in the solar industry. Our experts have taken a close look at 3 use cases across the 8 different states and territories to help Australians work out whether solar batteries are a worthwhile investment in their scenario. This is the deep dive version of our popular ‘are they worth it?‘ article and has been recently updated to include the national battery rebate.
To be as transparent as possible, we’ve detailed our approach and methodology in this article. Please send through any feedback and we will take it into consideration for our next update.
Who Should Consider a Solar Battery?
3 User Types Identified for Solar Battery Storage
To make the results relevant for your situation we recommend looking at the below 2 scenarios for a solar battery and pick the one that is the closest fit. We have considered 3 common user types and matched their electrical usage patterns with data we have in our model. If there is nothing you believe to be relevant to your situation, you can read our methodology and put your own parameters into the Solar Choice Solar & Battery Calculator – Advanced Version.
| 1. Out during the day | Typical working professional households Average usage 15kWh per day | 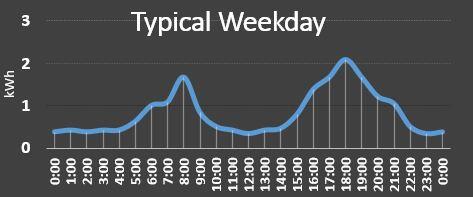 |
| 2. At home during the day | Households with someone home during the day like work from home or retirees Average usage 25kWh per day | 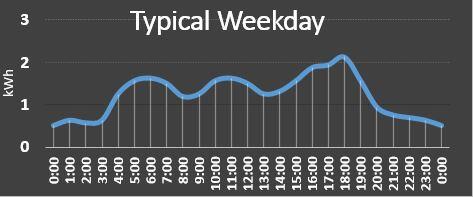 |
| 3. Big energy user | Households with high daily usage with 4+ occupants, Electric Vehicle, air conditioning, swimming pool etc. Average usage 40kWh per day | 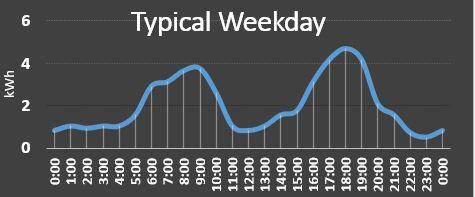 |
How to Size Solar Panels and Batteries for Your Energy Usage
To get the greatest utility from your solar battery you need to ensure that it will still be able to fully charge from your Solar Panels most days through winter when you are receiving the lowest amount of sunlight. In our calculator, we looked at various solar battery options and found the below options provided a good balance between grid energy independence and financial return. You can also use our advanced calculator to trial different battery sizes and see what size could be charged most days through the months with the lowest sunlight (June, July and August).
Given system performances will depend on sunlight patterns and the location within Australia, for the below figures we have used data from Sydney’s weather patterns. You will see that our results have been broken down into capital cities and our calculator has all the data built in.
| Average Usage Per day | Optimal Solar System Size | Solar Output in Winter | Solar Output in Summer | Solar Battery System Size | |
| 1. Out during the day | 15kWh | 5 kW | 13 kWh / day | 24 kWh / day | 5.7 kWh |
| 2. Home During the day | 20kWh | 6.6 kW | 18 kWh / day | 31 kWh / day | 6.5 kWh |
| 3. Big energy user | 40kWh | 13 kW | 35 kWh / day | 62 kWh / day | 13.5 kWh |
Compare solar and battery quotes from local installers now.
Our Methodology and Key Assumptions
We inputted the below information in our advanced solar battery calculator which was developed by Solar Choice’s engineers. It utilises functionality from our proprietary solar project financial model which we have used to consult with businesses across many of Australia’s largest commercial solar roll outs and utility-scale solar farms.
Assumed Electricity Prices
Using our electricity plan comparison tool, we found some of the most competitive retail electricity plans on offer in each city and plugged them into our solar power battery calculator. The figures we ended up using are detailed in the table below. (Important to note that the rates in the table below are inclusive of retailer discounts – for example, pay on time discounts and/or pay online discounts.)
| City | Solar Feed In Tariff (cents per kWh) | Off Peak Rate (cents per kWh) | Shoulder Rate (cents per kWh) | Peak Rate (cents per kWh) |
| Adelaide | 4 | 27.73 | 23.16 | 47.44 |
| Brisbane | 3 | 22.43 | 24.46 | 40.46 |
| Canberra | 5 | 20.44 | 26.16 | 36.83 |
| Darwin | 9.33 | 26.27 | 34.45 | |
| Hobart | 9 | 16.61 | 35.75 | |
| Melbourne | 4 | 15.4 | 29.15 | |
| Perth | 2 to 10 | 23.12 | 8.4 | 52.53 |
| Sydney | 4 | 28.35 | 28.35 | 53.72 |
Solar Battery Storage Options
We have selected to use the below home battery storage systems for each system size. [Please note: Solar Choice is agnostic to product manufacturers and we have no desire to influence your choice of product. We have just selected products that are commonly used in the Australian market]
- For the ‘large’ solar battery system, we used Tesla Powerwall 2, which has a usable energy storage capacity of 13.5 kWh;
- For the ‘medium’ solar battery system, we used LG Chem RESU, which has a usable energy storage capacity of 6.5 kWh; and
- For the ‘small’ solar battery system, we used Alpha ESS, which has a usable storage capacity of 5.7 kWh.
All solar and battery output and technical information has been set in line with the verified product specifications published for each product. The results would not change materially if the above products were swapped for different brand names with the same capacity.
Other Assumptions (click to expand) ▼
Results by Each User Type
We have calculated the outputs from our calculator based on the individual characteristics of each energy user, system size, relevant system costs by each capital city in Australia. In the below sections we compare the following financial metrics:
- Payback Period Solar & Battery – the time it takes for the total savings for the project to recover the upfront costs of the solar and battery
- Payback Period Battery Only – the time it takes for the savings made by the battery to pay for the upfront battery cost (excl. solar costs and savings)
- Total Year 1 Savings – the amount the energy bill would be reduced by in the first year
Out During The Day
For the ‘out during the day’ user scenario we have assumed an average daily energy use of 15 kWhs. Given the assumed energy use patterns we have recommended 5kW of Solar Panels and a 5.7 kWh battery storage solution.
| City | Battery Cost | Solar Cost | Payback Period (Solar & Battery) | Payback Period (Battery Only) | Total Year 1 Savings |
|---|---|---|---|---|---|
| Adelaide | $4,332 | $4,520 | 6.5 | 7.1 | $1,462 |
| Brisbane | $4,332 | $4,860 | 6.3 | 6.8 | $1,521 |
| Canberra | $4,332 | $4,240 | 6.9 | 8.6 | $1,311 |
| Darwin | $2,052* | $7,600 | 7.0 | 7.3 | $1,451 |
| Hobart | $4,332 | $6,100 | 9.7 | 13 | $1,194 |
| Melbourne | $4,332 | $4,930 | 10.5 | 11.9 | $831 |
| Perth | $1,482* | $4,290 | 5.5 | 3.2 | $1,167 |
| Sydney | $3,477* | $4,660 | 5.8 | 5.6 | $1,535 |
Explore the numbers yourself with our Solar & Battery Storage Sizing & Payback Estimator tool
At Home During The Day
For this energy profile we have assumed an average daily energy use of 25 kWhs with more energy being used during the daytime. Given the assumed energy use patterns we have recommended 6.6kW of Solar Panels and a 6.5 kWh battery storage solution.
| City | Battery Cost | Solar Cost | Payback Period (Solar & Battery) | Payback Period (Battery Only) | Total Year 1 Savings |
|---|---|---|---|---|---|
| Adelaide | $4,940 | $4,960 | 5.7 | 10.2 | $1,925 |
| Brisbane | $4,940 | $5,250 | 6.0 | 8.0 | $1,873 |
| Canberra | $4,940 | $4,710 | 5.5 | 8.9 | $1,953 |
| Darwin | $2,340* | $9,320 | 6.0 | 7.1 | $2,115 |
| Hobart | $4,940 | $6,970 | 8.5 | 13.9 | $1,406 |
| Melbourne | $4,940 | $5,430 | 8.5 | 12.7 | $1,216 |
| Perth | $1,690* | $5,250 | 5.1 | 3.3 | $1,575 |
| Sydney | $3,965* | $5,080 | 4.6 | 5.6 | $2,358 |
Compare solar and battery quotes from local installers now.
Big Energy User
For this energy profile we have assumed a high average daily energy use of 40 kWhs focused in mornings and evenings with some loads shifted to the daytime (e.g. swimming pool). Given the assumed energy use patterns we have recommended 13 kW of Solar Panels and a 13.5 kWh battery storage solution.
| City | Battery Cost | Solar Cost | Payback Period (Solar & Battery) | Payback Period (Battery Only) | Total Year 1 Savings |
|---|---|---|---|---|---|
| Adelaide | $9,180 | $10,127 | 6.0 | 10.1 | $3,496 |
| Brisbane | $9,180 | $10,725 | 6.4 | 7.4 | $3,337 |
| Canberra | $9,180 | $9,347 | 5.9 | 7.6 | $3,620 |
| Darwin | $3,780* | $16,978 | 5.6 | 6.3 | $3,923 |
| Hobart | $9,180 | $14,339 | 8.7 | 20.0 | $2,691 |
| Melbourne | $9,180 | $10,751 | 7.3 | 10.9 | $3,070 |
| Perth | $4,180* | $11,804 | 6.0 | 3.7 | $2,910 |
| Sydney | $7,155* | $9,906 | 4.9 | 5.0 | $4,141 |
Solar Battery Storage Payback Results by Australian city
The attractiveness of a battery storage system varies depending on if you reside in Adelaide, Brisbane, Canberra, Darwin, Hobart, Melbourne, Perth or Sydney. Each city has its own significant variables including sunlight patterns, energy costs and solar system prices. We have input these parameters in our model and compared the outcomes in the below graph.
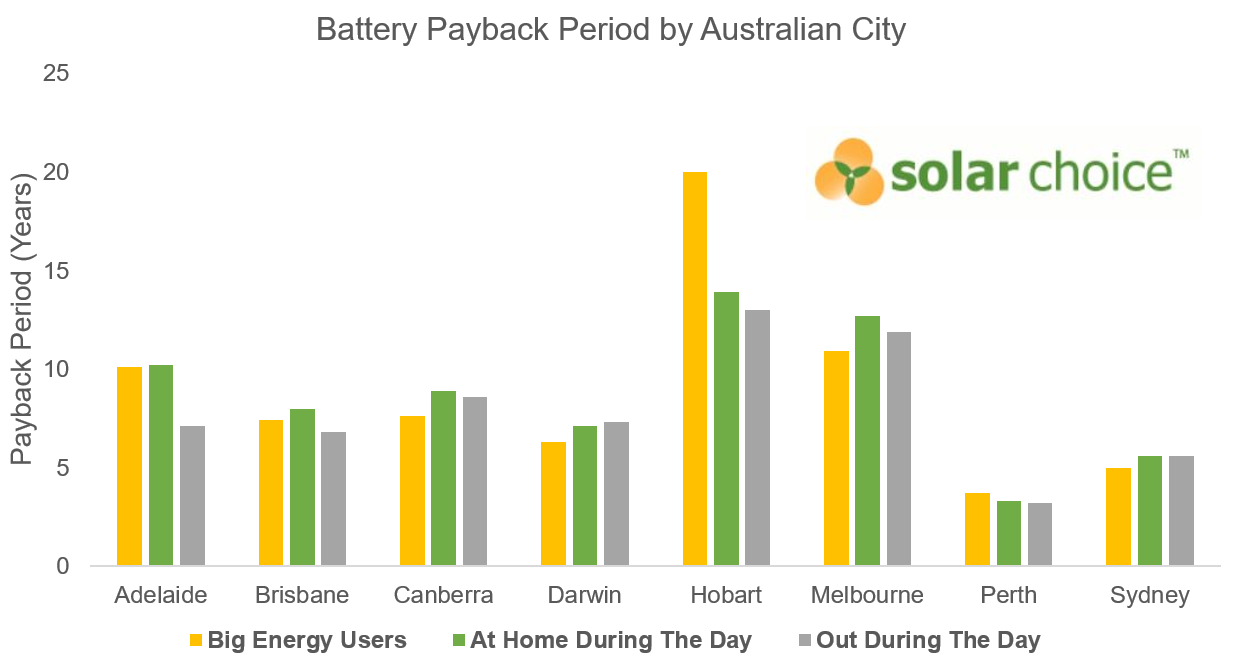
Based on our analysis Perth, Canberra and Sydney are the best cities to install solar batteries. Sydney and Perth are suffering from high energy prices and have attractive sunlight hours for solar projects. Hobart offers the worst return on investment due to unfavourable sunlight patterns and more expensive solar project costs.
Conclusion: Batteries make financial sense in many scenarios
When looking only at the revenues that the battery storage system will add to your solar project, across the 24 scenarios we compared, there were 11 cases where the battery had a payback period in under 8 years. From our observation with solar adoption, this has likely crossed an acceptable threshold for many customers to make the leap.
This has changed significantly in recent times with the introduction of a federal battery rebate. The financial return on batteries is highest in WA and NSW which also have a state-based battery rebate scheme which can be combined with the federal rebate.
This analysis does not include any additional revenue a battery owner could earn from participating in a Virtual Power Plant (VPP). It is difficult to accurately forecast revenue from these schemes as most of them depend on unusual pricing events occuring on the wholesale electricity market. At present it appears unlikely that these schemes would materially affect our conclusion to this analysis.
Since 2008 our knowledge and sophisticated software has allowed over 300,000 Australian households and businesses to make a well-informed choice on their solar & battery installer.

- EV Charging Backbone at Surry Hills Apartment Building - 30 March, 2026
- The Top 5 Problems With Cheap Air Conditioning Quotes - 12 January, 2026
- Running Cost of Air Conditioners – Explained - 7 October, 2025