I never thought I’d find myself chasing up with my electricity company to ask for an electricity bill, but two weeks ago that’s exactly what I was doing.
I’d been living in my new house for over three months and still hadn’t heard a peep out of Energy Locals about what I owed them. If I were a normal person, I would have just let this be – if your electricity company forgets to send you your bill, isn’t that their problem? But having been writing about solar for (going on) eight years now and having become accustomed to paying over $700 for a quarterly bill, I was nerdily desperate to know how much lower my bill would be with solar, having just moved into a house with a quirky preexisting system about 4 months ago (n.b. it’s actually two separate systems).
The delay in getting my bill probably had something to do with the fact that Energy Locals are a relatively new company who are still sorting out their IT systems; I ended up falling through the cracks. Not really the best look for a company, but they were very responsive and friendly in getting it sorted out for me and I’ve got no regrets choosing them as my supplier.
(I note that 90% of our correspondence happened via their online chat window on their website, which pretty convenient and easy to use. The remaining 10% happened over email.)
When I finally got the bill last Friday and didn’t have much time to look it in detail, even though I was immediately keen to tear it apart and write about what it all means. I spent the weekend dreaming about what I’d do with the numbers, and a bit of time of Monday slicing and dicing them to work out what happened over the billing period. Then I wrote this article.
Compare Solar & Battery Quotes
Let’s start with the headline.
Solar savings are for real: Having panels on my roof saved me a fair amount of money
At my previous residence – a rented, all-electric, uninsulated 3-bedroom flat in Sydney’s inner west – my electricity bills were easily coming in at over $700 per quarter (after discounts) with EnergyAustralia. It was especially bad in the winter, where the only warming devices we had at our disposal were column/oil heaters which oftens ran all night (and occasionally all day).
So much for the idea of solar being a scam. Even taking into account that the difference in seasons, electricity retailer and tariff plan (my old plan was block/flat rate and my new one is time of use), there’s no comparing $800 and $235.
Here are the ‘before’ and ‘after shots’:
Before solar:
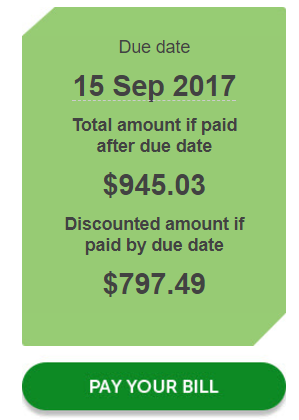
‘Before’: My last electricity bill from EnergyAustralia at my previous residence (a 3br rental flat).
After solar:
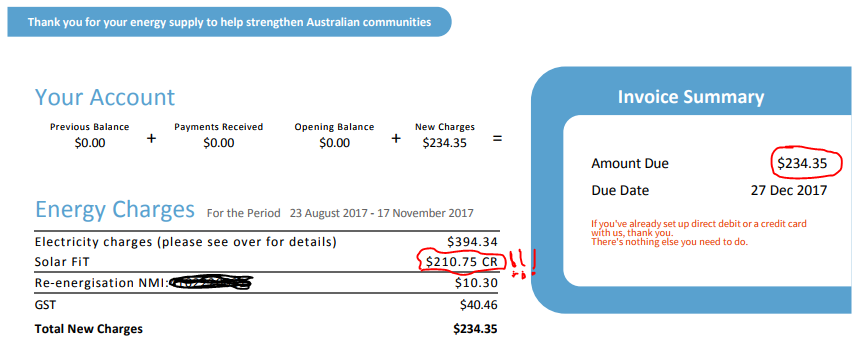
‘After’: My first energy bill (from Energy Locals) at my Newcastle house with 4.4kW of solar (a reasonably sized 3br house with ducted AC). Not only are the usage charges lower than before, there’s also a whopping $210 credit from the solar our system fed into the grid (earning us ~13c/kWh in feed-in tariff credits).
Bill charges (and credits) breakdown
I’ve broken down my bill charges in the table below and was surprised to see that the amount of energy I’m purchasing from the grid on the average day (18.9kWh) is about equal to the amount of solar I’m sending into the grid (18.8kWh). This means that I’m nearly net energy neutral (at least for spring).
It also means that with a bit of effort, we might even be able to become net energy positive – although this could be tricky with the hot weather approaching and the temptation to switch on the AC all too enticing.
And with that much excess energy, the door is wide open for the possibility of installing battery storage in the future. Batteries would help us battle the high peak rates in the afternoon (from 2pm-8pm), which currently make up the largest part of our standard consumption charges (excluding controlled load hot water) despite accounting for the smallest number of units (about 2.3kWh/day).
| Charge / credit per kWh | Total kWh | Total charges | Average daily kWh | Average daily charge | |
| Peak | $0.37 | 203.1 | $75.13 | 2.3 | $0.86 |
| Shoulder | $0.17 | 408.6 | $69.47 | 4.7 | $0.80 |
| Off-peak | $0.14 | 348.4 | $48.77 | 4.0 | $0.56 |
| CL 2 (water heating) | $0.16 | 685.1 | $109.61 | 7.9 | $1.26 |
| Total average daily: | 18.9 | $3.48 | |||
| Other info | |||||
| Solar feed-in credits | -$0.13 | 1637.6 | -$210.8 | 18.8 | -$2.42 |
| Supply charge (daily) | $1.05 | 87 days | $91.35 | ||
What about solar self-consumption? Crucial but invisible on electricity bills
When I eagerly dug into the feed-in credit numbers, I noticed something odd: I seemed to be producing more solar than I thought possible with my 4.4kW solar system(s), even after taking into account the longer spring days (and coinciding higher sunshine/solar fuel rates).
In total, I had exported almost 1,640kWh over 87 days – or about 19kWh per day. Electricity retailers do not show you on your bill how much of the solar energy you supplied to yourself (your ‘self-consumed’ solar energy is ‘behind the meter’) – only what they measure coming out of your house (the export). If I had a fully functioning solar monitoring system in place (soon!) I would be able to see all of this data laid out in sharp relief in colourful graphs, but for the time being I’ve got to mainly rely on what everyone else does – a 2-page electricity bill with nothing but a rough breakdown and the totals, plus the monitoring I can do on my system with the GoodWe inverter and the slightly out-of-whack insights I can get from my incomplete carbonTRACK system.
Energy purchase & solar export: Fun with heat maps!
Since 19kWh was the amount that I estimated my solar system would have produced in total per day over this period after efficiency losses, my first thought was that I was somehow still on a gross metering setup, in which all my solar energy is sent directly into the grid (and which is a relic of NSW’s old, government-backed Solar Bonus Scheme, which is now closed).
Doing a bit of background research, however (i.e. calling Ausgrid and checking the solar paperwork left in the house by the previous owners) I managed to confirm for myself without a doubt that I am indeed on net metering, which means that the solar energy flows first into my house to power any appliances/devices that happen to be on, and only passes through to the grid if there’s excess available.
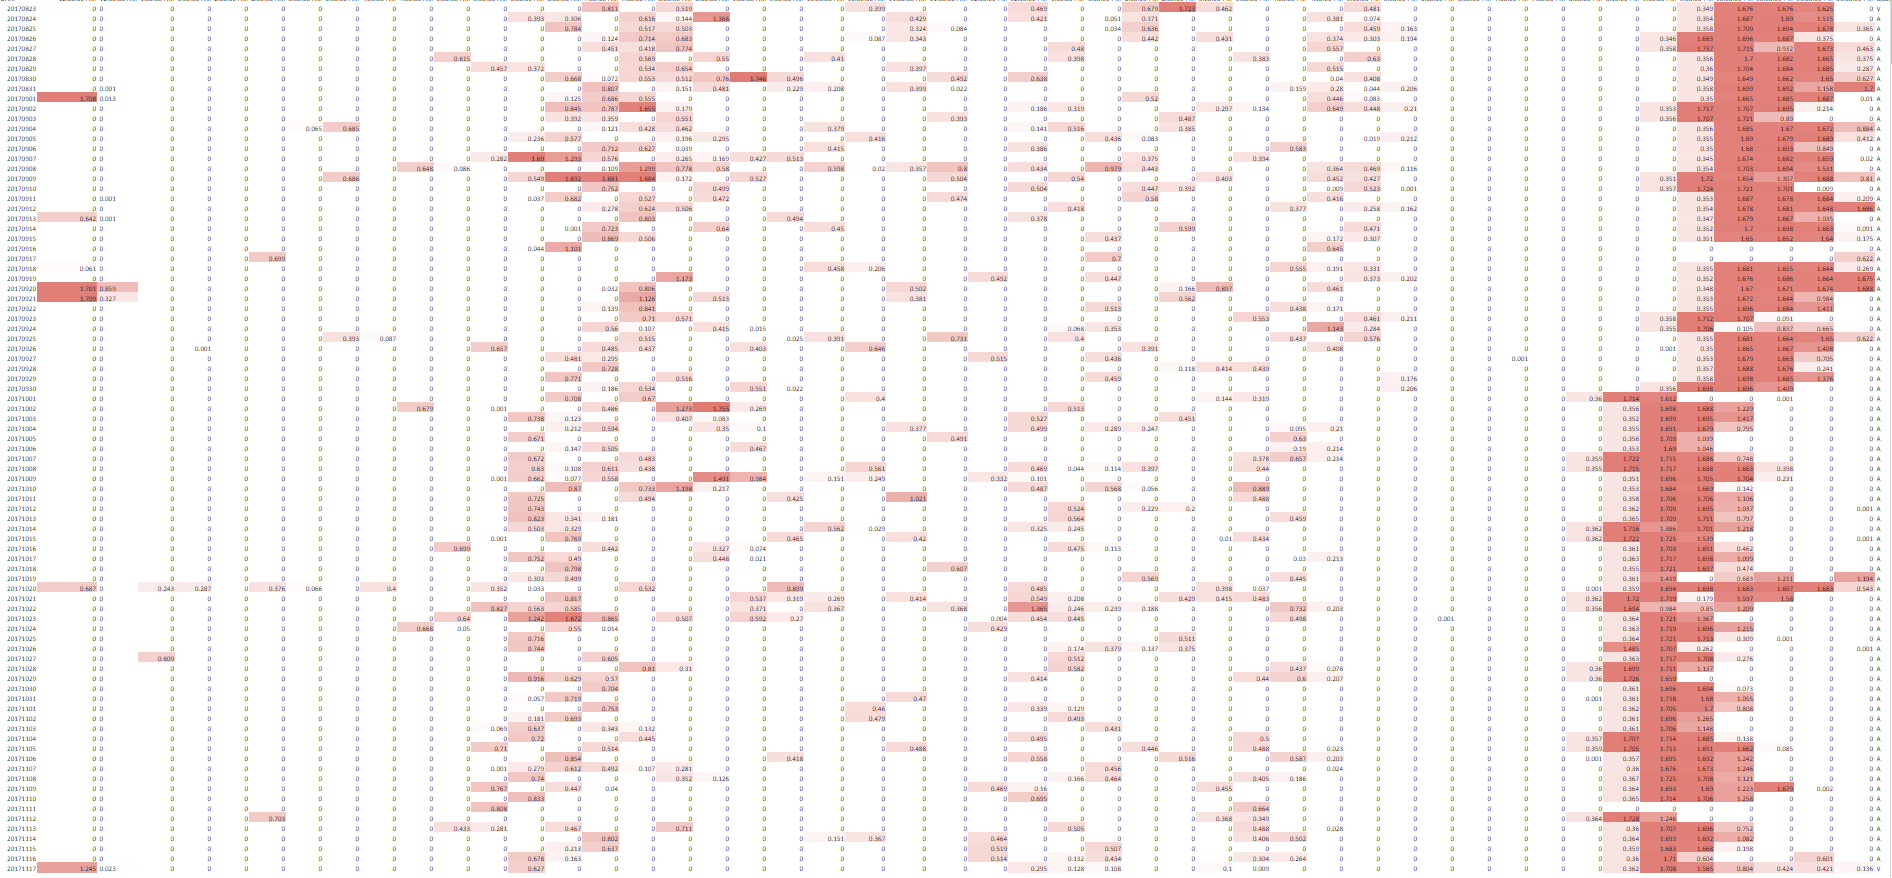
To get to the bottom of things, I managed to get a spreadsheet with my usage numbers (in half-hourly chunks) from Energy Locals, who just like all other retailers are obliged to share this data with anyone who’s got a digital interval meter installed. I took it and colour coded the cells by high/low/no grid draw (red/yellow/green) to produce the heat map below.
Anything in green in the table below means zero energy purchased from the grid.
Behold the majesty of solar!
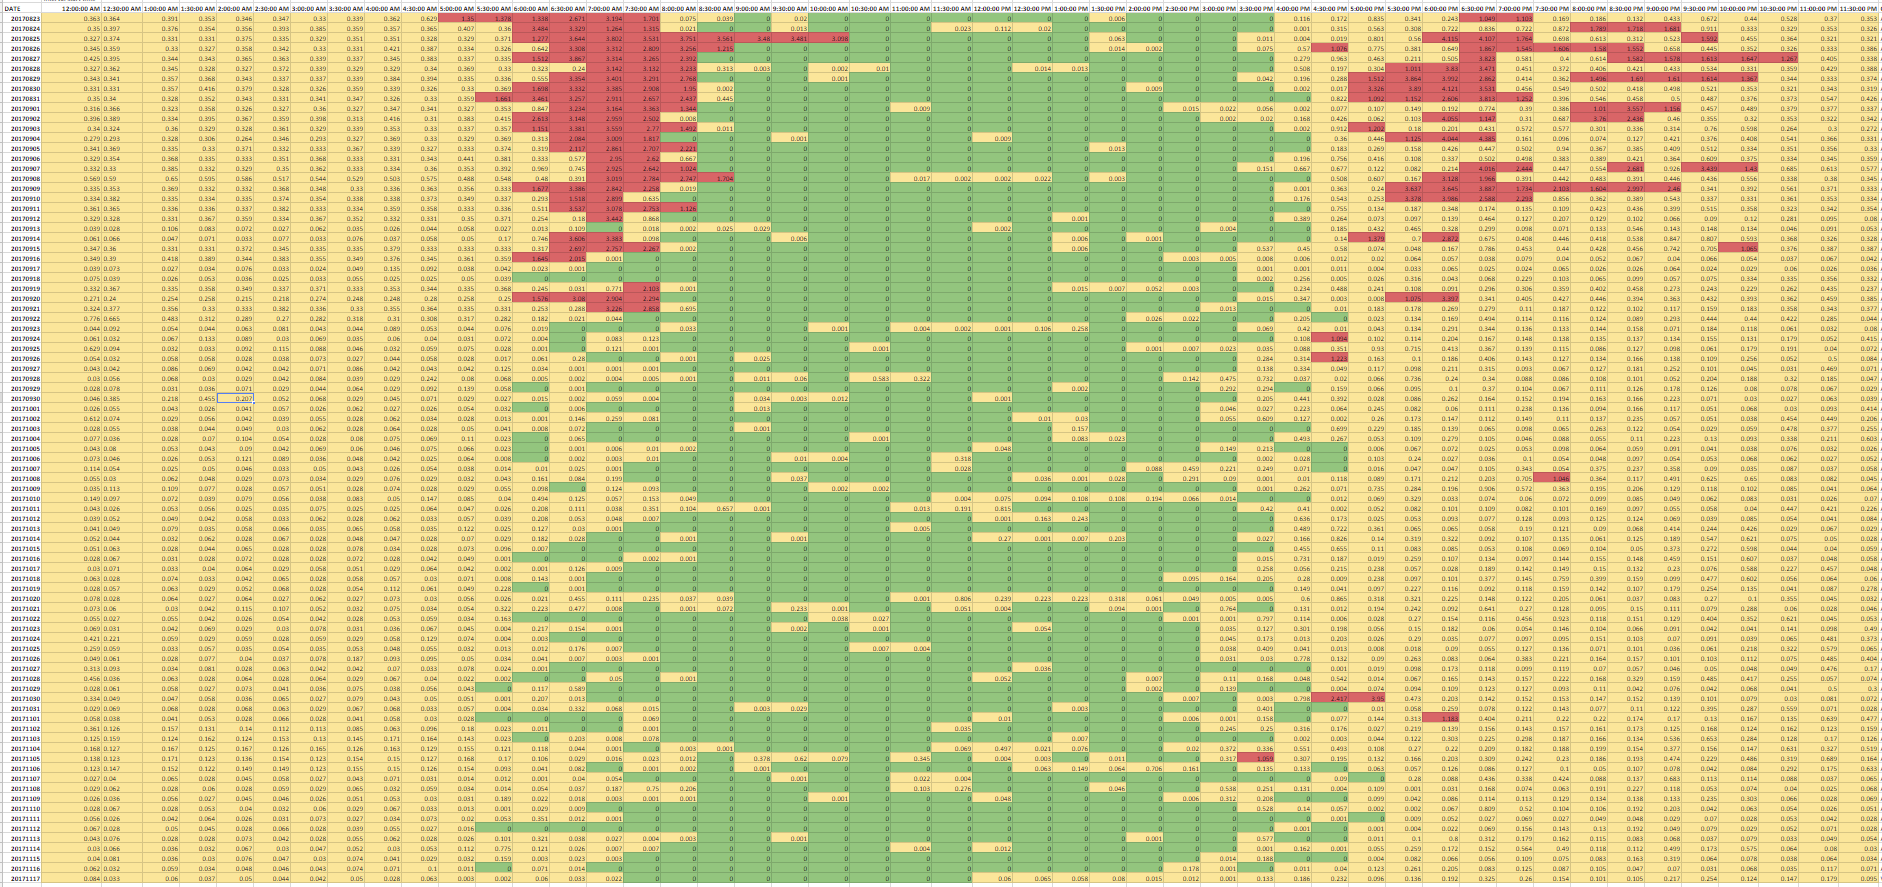
Grid energy purchase data for my home over the last billing period: Each row in the ‘heat map’ table above represents a day in the 87 day billing cycle, while each column represents a half-hour block of time during that day. Cells in green signify that we drew no electricity from the grid, while yellow cells signify grid purchase amounts less than 1kWh. Anything over 1kWh in a half-hour period is coloured red.
It’s interesting to observe that the red ‘high consumption’ cells start to disappear towards the end of September – right about the time the average temperatures got high enough to obviate the need for heating (using either ducted AC or oil heaters).
What does it all mean? More solar energy than expected
The big takeaway from all this is that the solar system has been producing more energy than would expected (19kWh/day, or about 4.3kWh per kW of solar capacity assuming 6 peak sun hours per day and a conservative efficiency rate of 75%). Because the self-consumed solar energy is invisible without a proper monitoring system, I can only guess as to how much ‘extra’ solar I’ve been putting to good use – but I imagine it’s in the region of about 3-5kWh.
The next chart below illustrates solar energy exported to the grid for feed-in credits. It’s clear to see that there’s plenty of surplus solar energy at my disposal during the middle of the day on most days that I can look into putting to better use over the coming months and years.
And in the meantime, that excess energy is earning me bill credits.
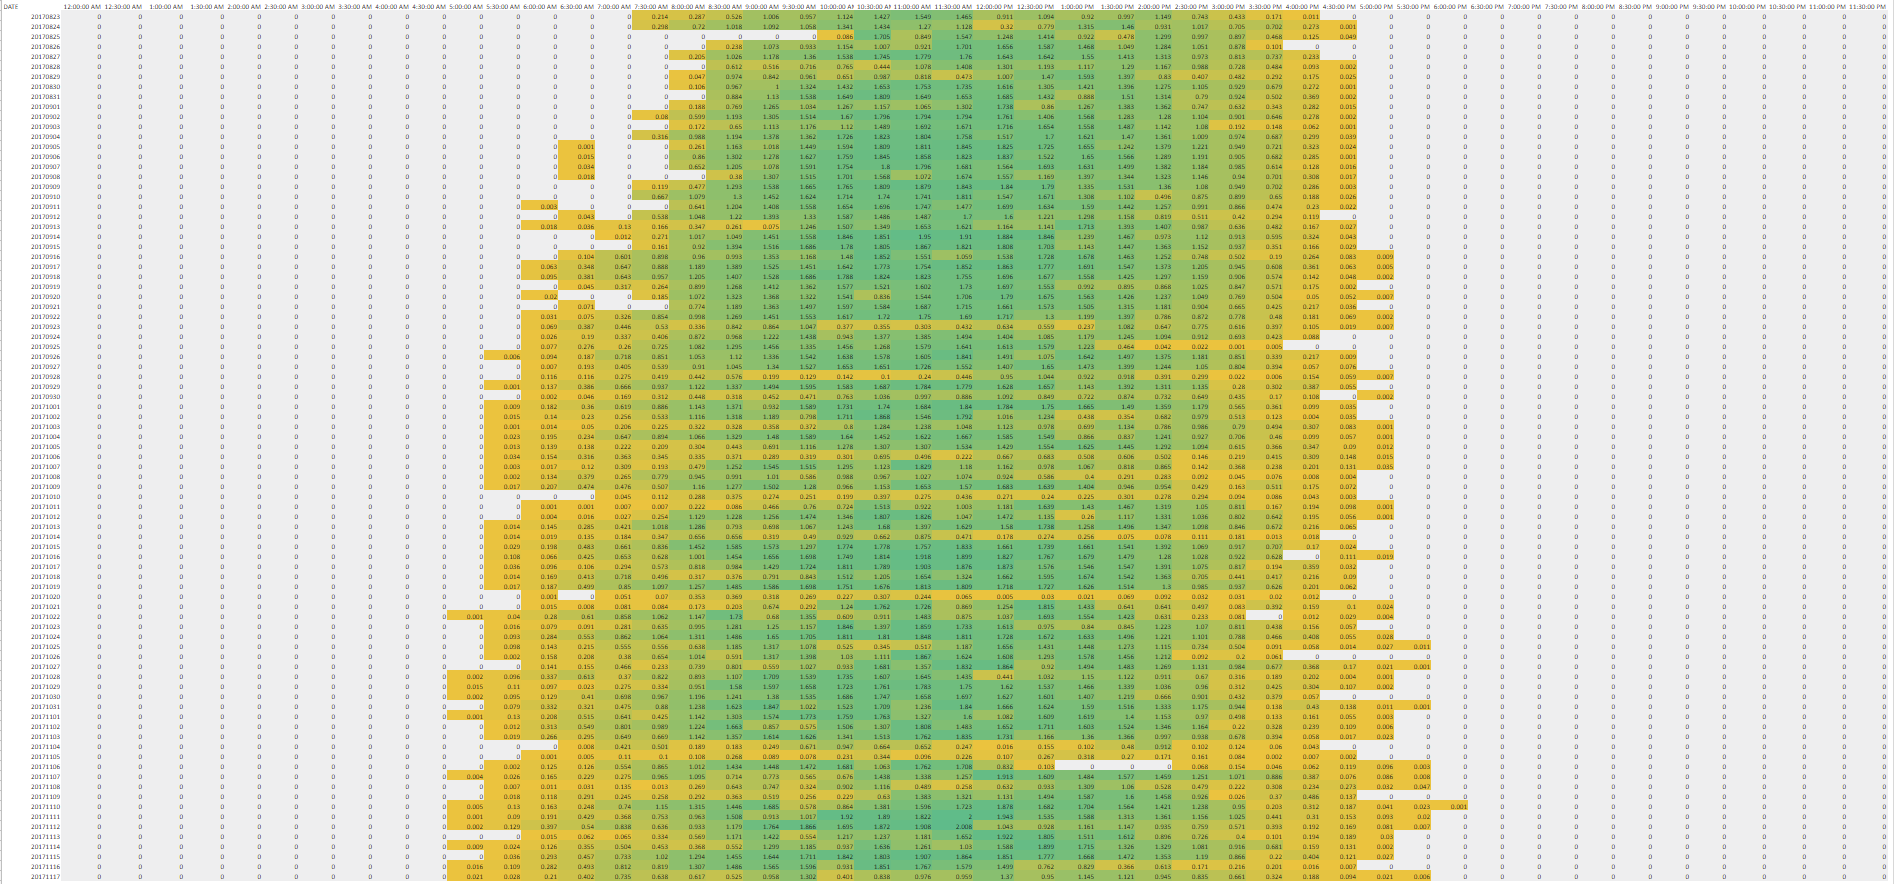
Solar energy export (feed-in) data from my home over the last billing period: Each row in the ‘heat map’ table above represents a day in the 87 day billing cycle, while each column represents a half-hour block of time during that day. The darker green the cell, the more energy exported, while orange cells represent lower export amounts. Grey cells indicate zero export.
The question of ‘controlled load’ hot water
Neither of the graphs above takes into account the separate controlled load circuit that my house has for hot water. Ausgrid (the network company, not my retailer) have a separate meter for my hot water, and they can switch the element on and off as they like throughout the day. This helps them to better distribute energy loads across thousands of households who also have controlled load hot water, and my retailer charges me a cheaper rate for the energy that does go towards water heating in my house.
I’m going to be moving my hot water onto my general time of use tariff so that we can control it ourselves using the soon-to-be-fully-installed carbonTRACK unit (so we don’t have to take cold showers). This will also allow us to only use the hot water when we need it (which could result in less running time for the tank element).
Scott at CATCH Power has informed me that solar can indeed be used to offset controlled loads, and judging by the heat map below for my controlled load charges (where darker red means higher charge), it seems that this is indeed what’s happening. The heaviest charges come in the evening, while all the daytime charges are lighter.
The outlook from here: Feeling positive about 2018
So in a nutshell, for the first time in my life, getting an electricity bill made me (perversely) happy. Having solar on my roof has definitely delivered for me, and without much effort besides trying to run shiftable loads during solar production times and off-peak rate times as much as possible.
This was a great bit of personal news to get at the end of a record-breaking year for the Australian solar industry as a whole – and a great anecdote about how solar can enable households to produce their own clean energy while saving money. (As an interesting side note to all this and a sign of the times, my adopted city of Newcastle – home to the largest coal port in the world – will apparently be aiming to phase out its economic reliance on coal. Good for you, Newcastle.)
The whole billing experience has reinforced my belief that solar is amazing. I’ve got these things sitting on my roof, making no noise and producing no emissions, simply soaking up the rays and providing my home (and my neighbours’ homes) with clean electricity.
What makes solar in Australia particularly amazing is the fact that it’s economical. This is something that I’m reminded of whenever I look at solar installation prices in the US, where they’re still looking at $3USD per watt (about $3.90/W in Aussie dollars). As big and populous as it is, my home country has nothing on Australia when it comes to small-scale solar.
In 2018 I’ll be looking into more ways that I can ramp up the benefits of having solar even more, as there seem to be ample opportunities to do so. Bring on the new year.
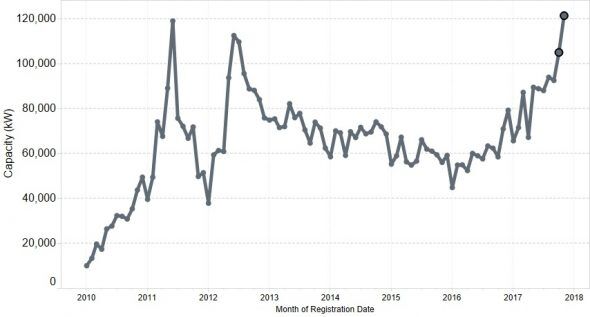
Historic solar installation rates in Australia – 2017 has been a record year. (Image via RenewEconomy/Sunwiz.)
Join our mailing list to follow along
Get a free, instant solar & battery quote comparison
Compare Solar & Battery Quotes
© 2017 Solar Choice Pty Ltd

He is now the communications manager for energy technology startup SwitchDin, but remains an occasional contributor to the Solar Choice blog.
James lives in Newcastle in a house with a weird solar system.
- Solar Power Wagga Wagga, NSW – Compare outputs, returns and installers - 13 March, 2025
- Monocrystalline vs Polycrystalline Solar Panels: Busting Myths - 11 November, 2024
- Solar Hot Water System: Everything You Need to Know - 27 February, 2024
Great article.
It almost completely mirrors my experience moving from Sydney non solar 4 bed house to a much larger 4 bed house with pool in Brisbane and putting on a 6KW system.
I moved my hot water from controlled load off peak to peak with a timer and that saves an extra 5KW of usage a day.
My average is down to about 9KW daily paying but using 27KW a day (18 offset by solar) plus a little bit of export to the grid for savings.