Solar is affordable in Australia – possibly more affordable than anywhere else in the world. But as much as sunlight may seem like ‘free energy’, you actually pay for the ability to convert sunlight into usable electricity when you purchase a solar system.
Aside from up-front price, one of the best ways to gauge affordability is the ‘levelised cost of energy’ metric (LCOE). When you look at LCOE, you’re looking at the total cost of each unit of energy that a generator (solar or otherwise) produces over its lifetime as a function of initial price as well as ongoing maintenance costs. An LCOE figure also serves as a fantastic comparison point for the rates that you pay your utility/retailer for energy that you draw from the grid.
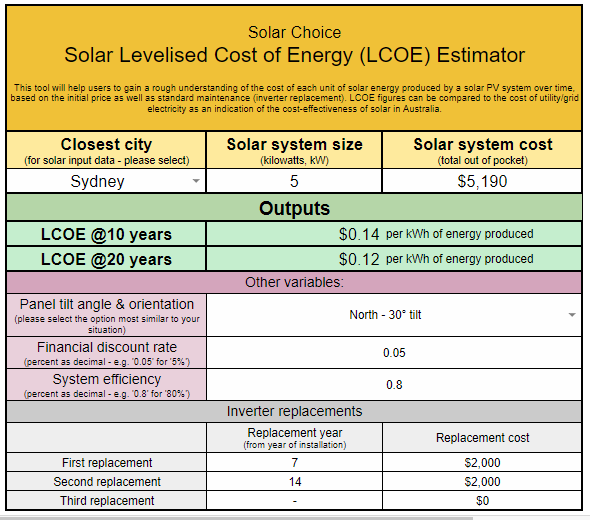
Out of curiosity and the drive to inform (both customers and our industry), we decided take a look at solar LCOE in Australia – so we developed a simple, Australia-focused solar LCOE estimator tool (which we’ve included at the bottom of this article). We’ve also conducted some analysis (and put together a table) about where things stand as of December 2017.
Compare Solar & Battery Quotes
Solar cost per kWh as of December 2017
 The results of our little analysis project were enlightening. We took a look at the LCOE for solar systems in all of the capital cities based on average prices from December 2017 for 3kW and 5kW systems and rounded them up in the table below alongside current grid electricity rates in each of those cities.
(Note that we include LCOE figures for both 10yr and 20yr periods. Since solar panels in Australia have a standard 25 year warranty, the 20yr LCOE columns are the most relevant to anyone looking into solar as an investment or to gauge the viability of solar vs grid electricity. We chose 20 years instead of 25 to be conservative. Also note that cost of 2 inverter replacements are factored into the analysis, as is a financial discount rate of 5%. The screenshot of the calculator to the right contains most of the rest of the assumptions.)
The national average LCOE for a 5kW system over 20 years was only about 13c/kWh. For 3kW solar systems, it was about 18c/kWh. By contrast, the average cost of retail electricity in Australia (i.e. the amount that households pay for electricity from their utility/retailer) stands at about 27c/kWh.
As per Table 1 below, while Perth had the lowest 20yr LCOE for 5kW solar systems, Adelaide, Brisbane, Canberra & Sydney weren’t far behind, with each coming in at either 11c/kWh or 12c/kWh for the same. As the southernmost (and least sunny) capital, Hobart had the highest LCOE for 5kW systems, at 18c/kWh. Meanwhile Melbourne and Darwin both came in at around 15c/kWh. (Sunny Darwin should have fared better, but was dragged down by higher system prices.)
20yr LCOE for 3kW solar systems was a bit higher, but still in the 13-16c/kWh range for 5 out of 8 capital cities (Darwin, Hobart & Melbourne were a bit higher).
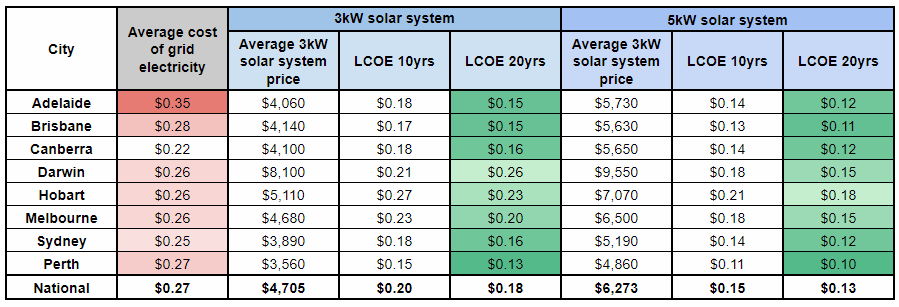
Table 1: LCOE estimates for 3kW & 5kW solar systems in Australia’s capital cities at average December 2017 prices. Darker green represents lower LCOE, while darker red denotes higher residential grid electricity prices. (Click to enlarge.)
Are we at ‘socket price parity’? Oh yes – and then some
Here’s the thing to remember: Residential grid electricity prices – the rates that Australian homes pay for electricity – have been increasing by leaps and bounds over the past decade or so. The term ‘socket price parity’ is sometimes used to describe the point at which it is cheaper to source your home’s electricity from solar than it is to source it from the grid – represented by the power sockets around your house. When the LCOE of solar is the same as the socket/retail price, we’ve reached ‘parity’. The current LCOEs for nearly all of Australia’s capital cities are all beyond parity with retail prices for both 3kW & 5kW systems.
Table 2 below (quickly sourced from a Google Images search) shows retail electricity price trends between 2001/02 and 2015/16. The increase from about is obvious, and doesn’t even cover the additionally massive leap that we saw happen in July/August of this year. It seems unlikely that they’re going to go down much in the near or even medium-term future; even the government isn’t anticipating decreases so much as a ‘leveling out’ once its proposed National Energy Guarantee is implemented.
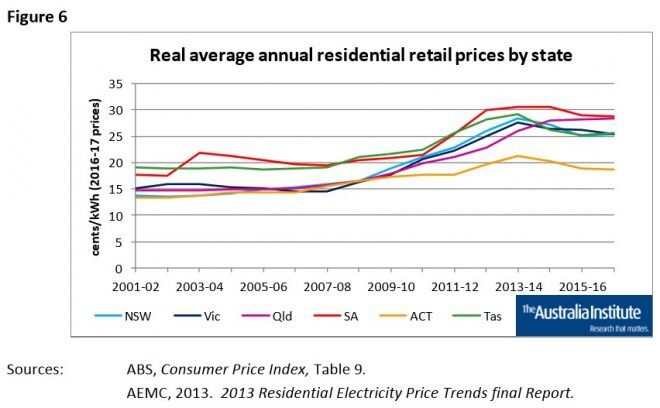
Table 2: Retail electricity price trends from the early 2000’s to 2015/16. Note that absent this chart is another increase that happened midway through 2017.
Meanwhile, solar system prices – the key determinant in solar LCOE – have only moved downwards. Table 3 below shows solar price trends from August 2012 to December 2017 (from Solar Choice’s Solar PV Price Index.)
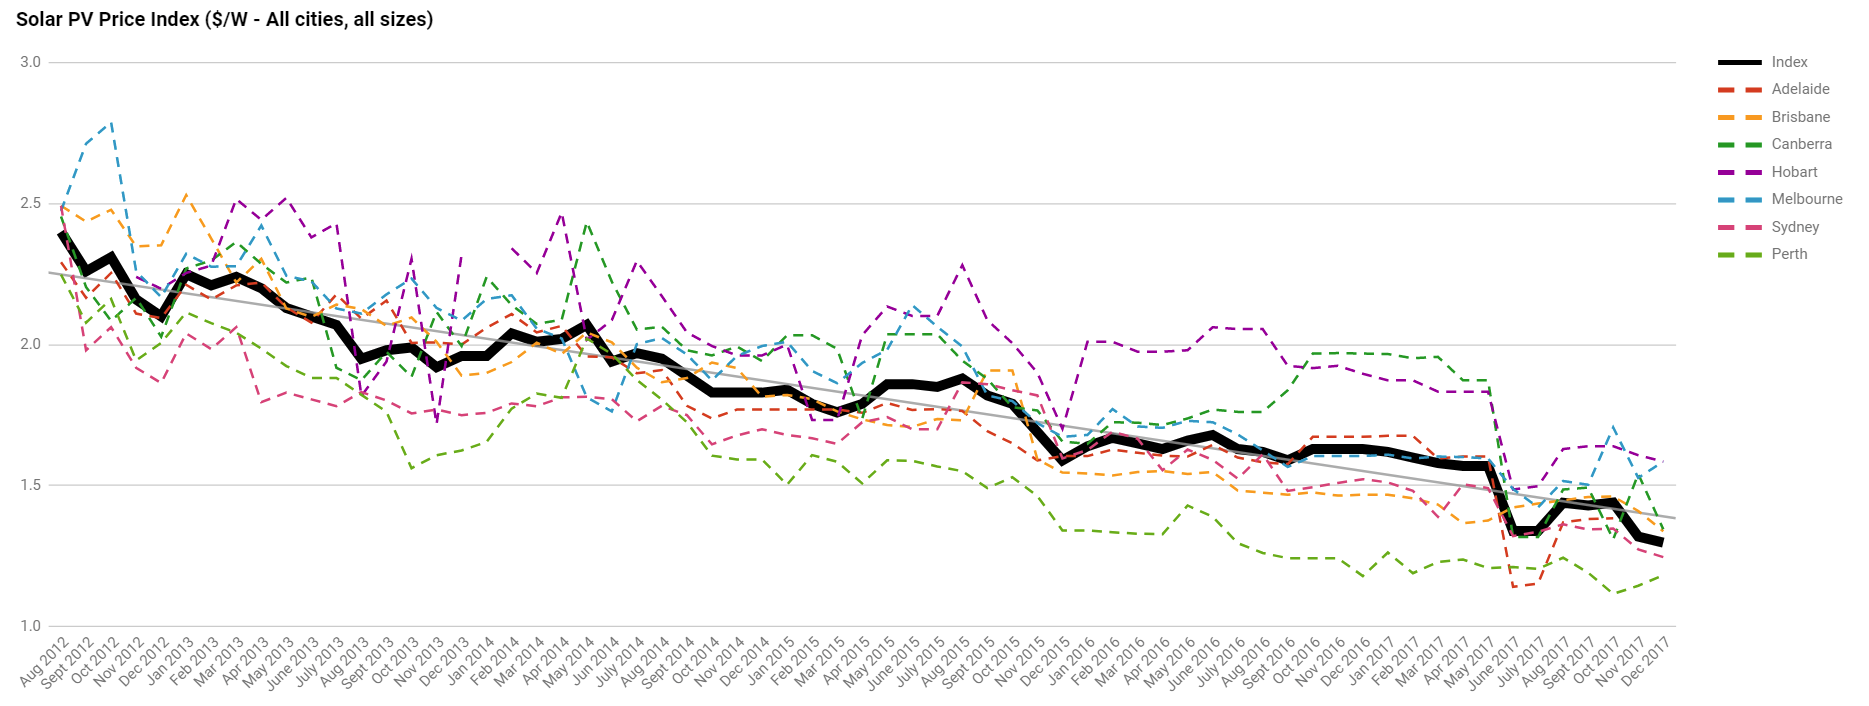
Table 3: Solar PV system installation price trends from 2012 to 2017.
The key takeaway from these two graphs is this: Going solar helps you to take control of spiralling electricity bills by sourcing a portion of your energy from your roof. Besides inverter replacements, the energy from your solar system will cost you nothing once the system is installed. Overall trends in grid electricity prices, on the other hand, are (almost) completely outside of your control.
Check out our Solar LCOE calculator
We put together the tool below to allow anyone to estimate solar LCOE for themselves. Please email us on communications@solarchoice.net.au if you have any questions or feedback about it.
Remember to dig deeper than LCOE
When it comes to deciding whether to go solar – and how much to spend on a system – there are plenty of other measures besides LCOE that you can look into. One of the limits of LCOE is that it doesn’t capture the value that solar system owners get from the solar energy that they produce; when they self-consume their solar, the value gained may be well over the lifetime LCOE, but in some places in Australia feed-in tariff rates are still well below it. In a nutshell, the higher the solar-self consumption and/or feed-in tariff rates, the more likely the actual value of the solar energy produced will get to its projected LCOE.
Payback period & return on investment (ROI – or its cousin IRR) are two of the most common metrics used to evaluate the performance of solar as an investment. You can read about whether solar is worth it in Australia in this article, or you can play with the numbers yourself using our Solar PV Payback Calculator.
Compare Solar & Battery Quotes

He is now the communications manager for energy technology startup SwitchDin, but remains an occasional contributor to the Solar Choice blog.
James lives in Newcastle in a house with a weird solar system.
- Solar Power Wagga Wagga, NSW – Compare outputs, returns and installers - 13 March, 2025
- Monocrystalline vs Polycrystalline Solar Panels: Busting Myths - 11 November, 2024
- Solar Hot Water System: Everything You Need to Know - 27 February, 2024