Rooftop solar on its own is already affordable enough to be a smart choice for virtually any Australian home with an unshaded roof and some daytime electricity usage. This is true even in the absence of generous, state-backed solar feed-in tariffs and the (slight) reduction of the up-front incentive for solar available through the federal Renewable Energy Target. In fact, last year over 300,000 Aussie homes installed solar panels.
(This article was originally published in January 2018. We’ve updated it to reflect the circumstances for 2020. We also just published a similar article about home battery storage, check it out: Is home battery storage worth it in 2019?)
The key to getting the most out of a solar PV system these days is to use as much of the energy as possible directly, within the home (‘solar self-consumption‘). Self-consuming solar energy helps the home to avoid purchasing energy from the grid, thereby saving between about $0.20-$0.30 per kilowatt-hour (kWh) depending on where they live and their electricity retailer. The rate solar households are paid to send their excess solar in the grid, on the other hand, is typically about 8-15c/kWh.
Solar system installation prices have been steady for the past few years- we know because we keep track of them in our Solar PV Price Index. No sudden reductions (or increases) are likely to be on the horizon; the market has stabilised after the initial turmoil of its first few years.
Going solar: Then vs now
Lots of things have changed in recent years with regard to solar power for homes. The business case for going solar – the investment-worthiness of solar panels – has quickly progressed through roughly three stages since the solar panel boom began in Australia in around 2008.
Making a long story short, these stages were:
Stage 1 (until about 2011): High solar system prices, high incentives. Lots of people installed solar despite relatively high prices thanks to government incentives on the federal and state level. “Solar is a no-brainer, and there’s a deadline!”
Stage 2 (2011-2014): Falling solar system prices, falling incentives. System prices fell, but so did incentives, creating a landscape of uncertainty. “Is solar still a good idea?”
Stage 3 (2014-present): Relative stability. Solar PV system prices come down significantly, and upheavals in the solar incentive sphere cease. However some attractive incentive schemes for solar and batteries exist at a state-level which are continuing to drive the market
Compare quotes from up to 7 installers in your area now.
Solar power is here to stay
At this point, it seems fairly clear that residential solar power is here to stay in Australia. Over 2 million homes already have a solar PV system, and there is now more than one panel installed per human being in the country. Virtually all industry analysts and investment houses – both within and outside Australia – are predicting that solar (and battery storage) are the future.
Solar system prices for homes have come down
Inevitably as the market matured and manufacturing facilities around the increased in scale the cost of production has plumitted. The chart below offers a glimpse into how average prices have changed since 2012.
Systems cost over 50% less to install in 2020 than they did in August 2012, according to our data that is used by Bloomberg NEF and the Australian Government.
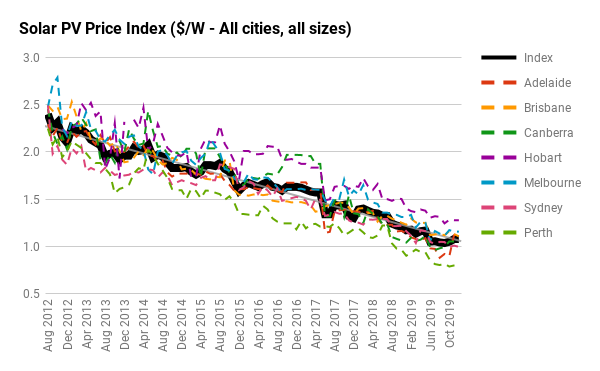
See individual graphs by city and system size in our Residential Solar PV Price Index blog articles
Average solar system sizes have increased
Several years ago, it was common for most homes to install 1kW, 1.5kW and 2kW solar systems. As prices have come down, however, the average solar system size has increased – and these days, 5kW, 6.6kW and even 10kW solar systems are not uncommon. In fact, the larger system sizes almost always offer better value for money than smaller ones.
Not sure which size system is best for your home’s needs? Check out our Quick Guide to Solar System Sizing or try Solar PV System Sizing Estimator Tool.
A look at solar payback periods in each capital city
Generally speaking, it’s important for homes to choose a solar system sized appropriately for their situation – meaning that they can use at least 30% of the energy it produces directly. However, if they can use even more (e.g. 50%), then the business case gets even better. According to our data, with a self-consumption rate of 30%, payback times for 5kW solar systems are under 6 years on average, nationally; in Adelaide, Brisbane, Darwin, Perth and Sydney they’re easily under six years, as per the table below. The internal rate of return (IRR – a metric for comparing investments similar to ROI but more comprehensive) for a solar system in each city is easily over 15% – on average 18% but as high as 32% in Adelaide.
Note that the table below uses average system prices to be conservative. Solar system owners may see even shorter payback periods and better IRR if they find systems for less without compromising quality, or if they manage to increase their self-consumption rates above 30%.
Table: Indicative 5kW solar PV system payback times & IRR by capital city*
| Average price for 5kW solar system(January 2020) | Price of electricity ($/kWh, incl GST and discounts)** |
Solar feed-in tariff rate ($/kWh – actual rates may vary slightly) |
Payback period (years, assuming 50% self-consumption) |
Internal rate of return (IRR) | |
| Adelaide | $4,900 | $0.35 | $0.10 | 2.5 | 41% |
| Brisbane | $5,000 | $0.22 | $0.07 | 3.9 | 26% |
| Canberra | $4,620 | $0.21 | $0.08 | 3.8 | 27% |
| Darwin | $9,610 | $0.26 | $0.26 | 4.3 | 23% |
| Hobart | $6,100 | $0.26 | $0.08 | 4.4 | 23% |
| Melbourne | $5,120 | $0.21 | $0.10 | 4.3 | 23% |
| Perth | $3,320 | $0.29 | $0.07 | 2.0 | 51% |
| Sydney | $4,070 | $0.29 | $0.09 | 2.5 | 40% |
| Average | $5,390 | $0.24 | $0.11 | 3.5 | 32% |
*Outputs in table assume average electricity consumption of 25kWh/day, north-facing panel array tilted at 30 degree pitch, electricity inflation rate of 2.5% per annum and discount rate of 5%. Note that we haven’t examined the case for going solar on a time of use tariff type, but that results are generally similar.
**Based on figures from the most competitive plans on EnergyMadeEasy and other relevant websites.
Request a free solar business case and compare leading commercial installers
Conclusion: Is solar PV still worth it in 2020? Absolutely
In 2019, solar panels in Australia remain affordable and attractive, especially in light of the plague of high electricity prices. Solar feed-in rates may be not be spectacular, but with system prices as low as they are it’s not difficult to see favourable returns from putting solar on your roof, particularly if you shop around and manage to find a good deal. Furthermore, making efforts to increase your rate of direct solar energy consumption (e.g. with a home energy management system) will also help to maximise returns.
In places where low system installation prices collide with high electricity prices, solar makes spectacularly good sense without much effort. But even in cities with higher average system prices put payback periods over 6 years in our examples, it doesn’t take much to improve the financial case. We recommend shopping around for the best deal possible and ensure that you can use the solar energy that your system will produce.
Explore solar PV system payback times for your home with our Solar PV System Payback Estimator Tool

- Why a big battery could be cheaper than a small battery with the federal rebate? - 19 June, 2025
- Heat Pump Costs – Solar Choice Price Index - 1 June, 2025
- Solar Panel Costs: Solar Choice Price Index | July 2025 - 1 June, 2025