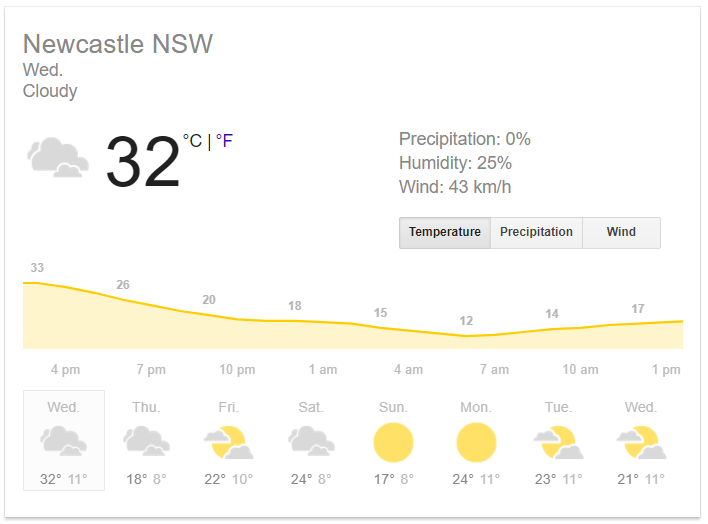
Spring is here, and it finally feels like it with two consecutive warm days yesterday (high of 28C) and today (high of 32C). The main implication of this is that for the first time since moving in, we haven’t been tempted to switch on the ducted AC (or wear socks) in the morning or evening to avoid freezing. Instant energy savings! Looks like we’ll be back to it tomorrow, though.
How much solar energy is the system producing?
The other upshot of the longer spring days is more solar energy production. With a bit of help from my assistant, I’ve been carrying out random manual checks of the inverter outputs throughout the day until I get properly hooked up with some monitoring (more on that below).
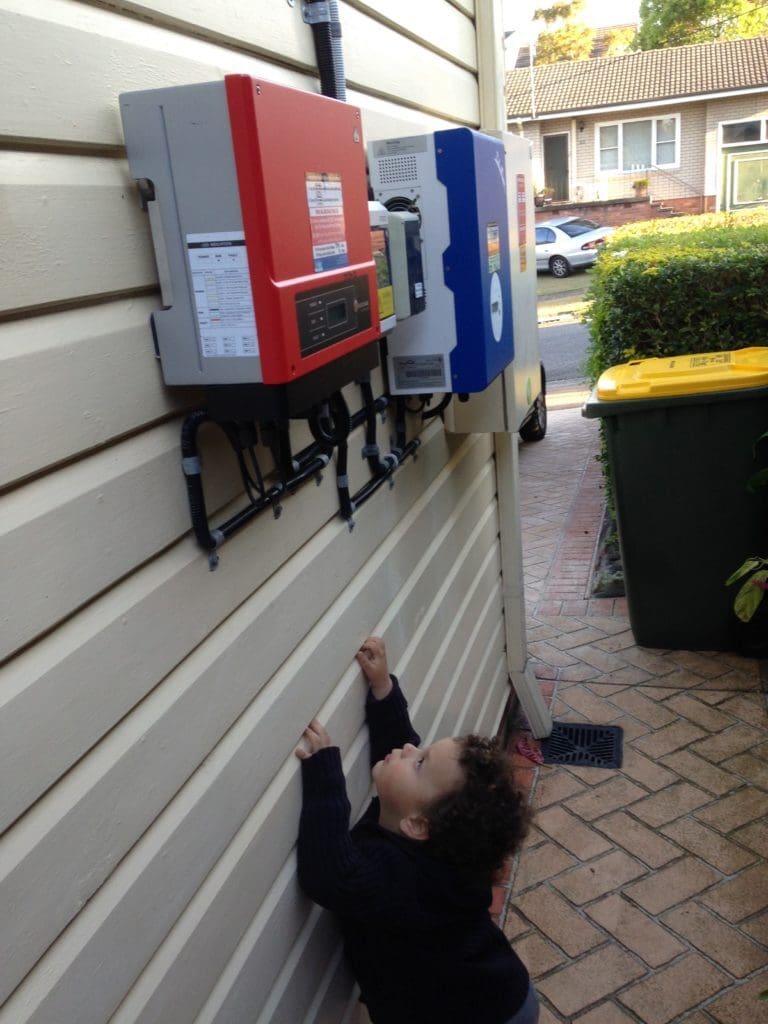
‘Checking the solar panels.’ I should probably explain that we’re actually checking the inverters, but he’s happy as long as I let him push the ‘function’ button on the Samil. (Bad father?)
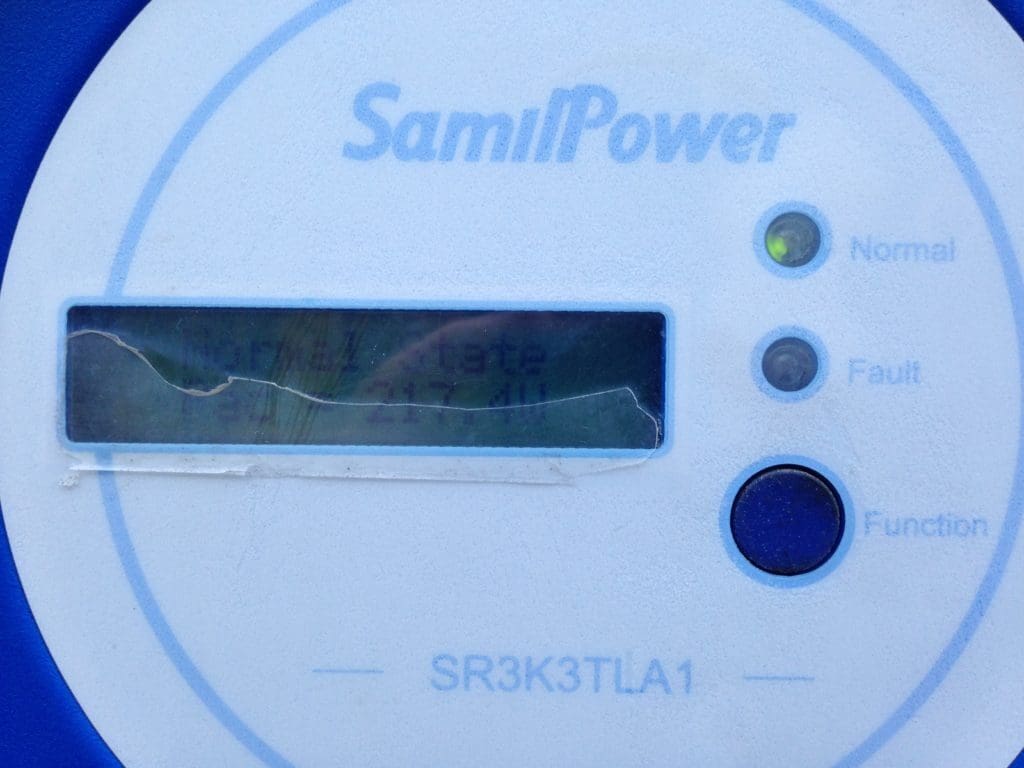
For example, today we’ve got some excellent sunshine with intermittent clouds going on, so I had a look to see how things were coming along.
0.217 kilowatts due to cloud cover one minute…
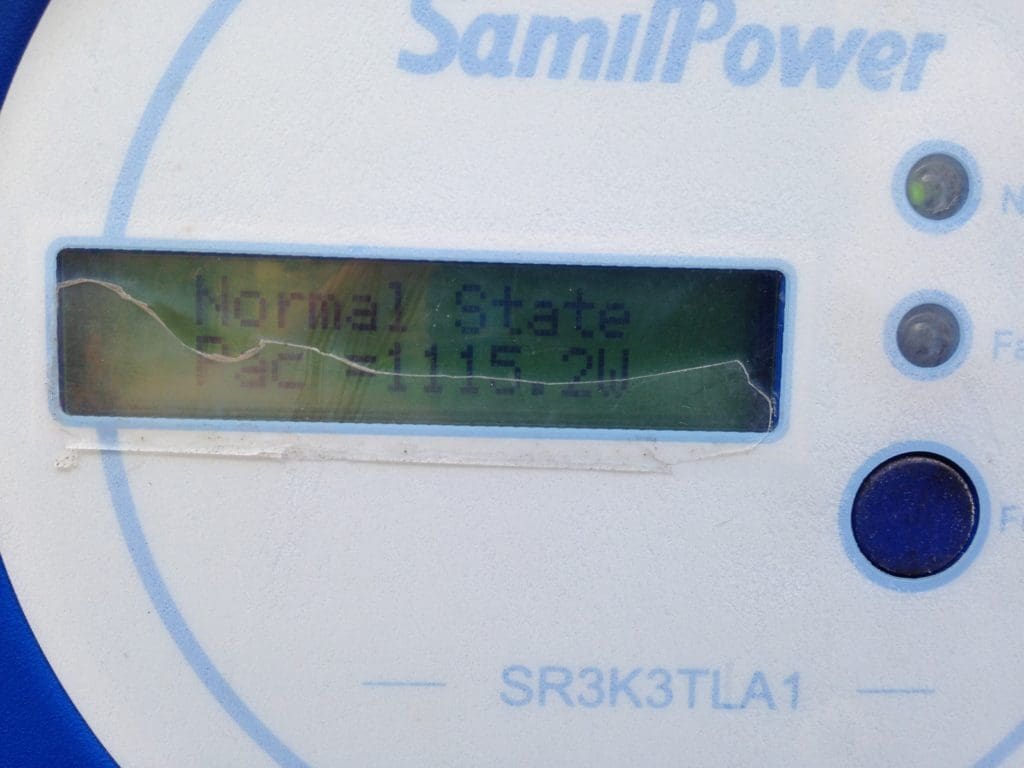
…then 1.115kW the next. Clearly, the cloud moved.
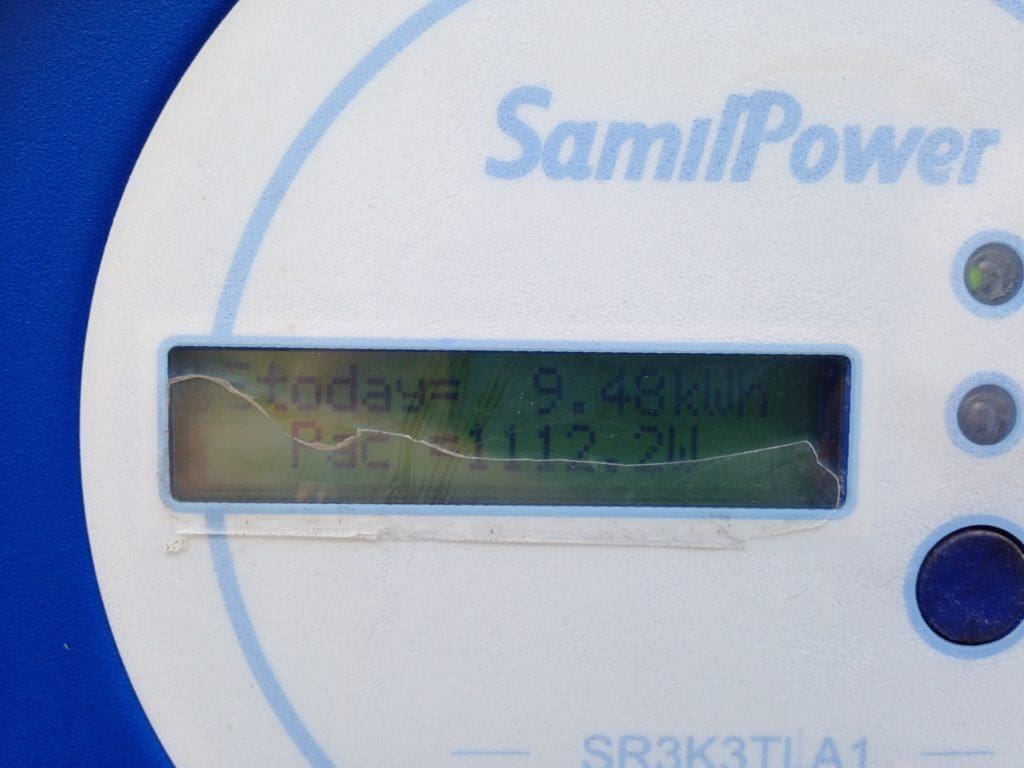
Total solar production for the day at around 3:00pm: 9.5 kilowatt-hours (kWh) – and that’s only half the system.
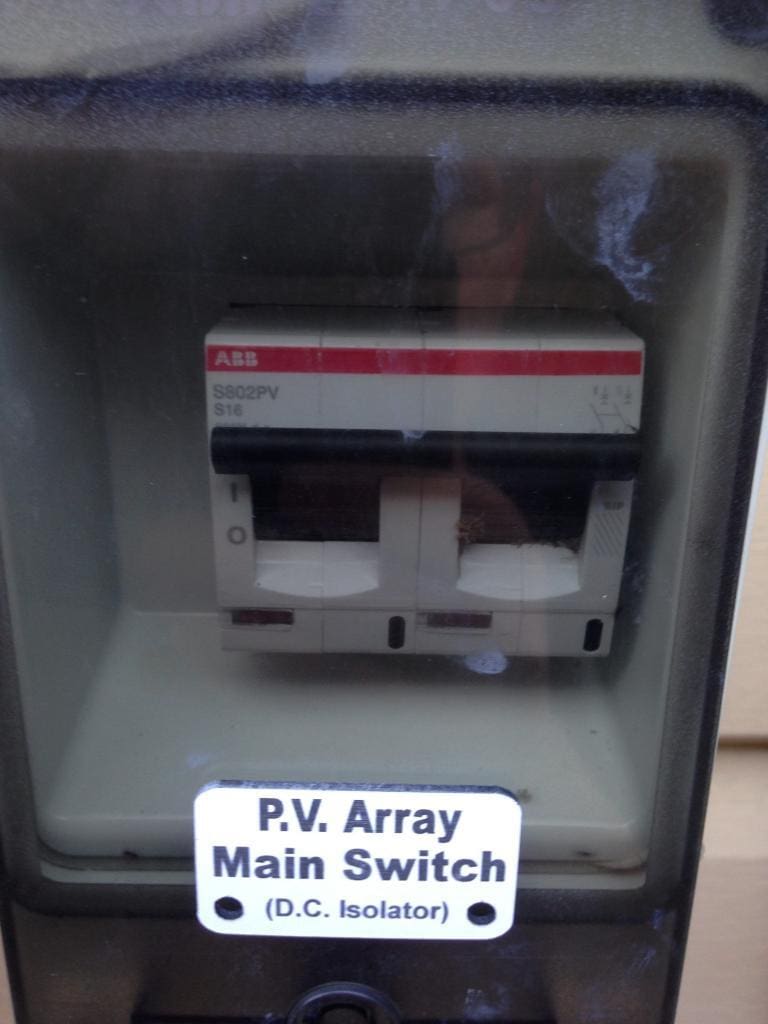
While we were at it we noticed that the system’s DC isolator (the safety shutoff switch for the solar panels) was aswarm with ants, who were busy eating something dead inside.
‘Faster than an ant eating something dead of a DC isolator’ – a punchy new phrase that I’ve just coined. (The speed explains why I was unable to catch them in a photo.)
How much am I earning through solar feed-in (and saving with self-consumption)?
All up, I’m estimating that we’ll probably have at least 20kWh of energy produced by end of day – which seems pretty high (and pretty good) for a 4.4kW solar system just coming out of winter.
Which got me thinking about solar feed-in tariffs. I’m home working during the day, but because there’s no heating (or cooling) on our home’s energy needs are fairly minimal – which means most of the solar energy is going into the grid. I wondered how much we’d be earning for our excess solar and how much of the heating-driven spending of the previous week it would help us claw back.
The feed-in tariff rate from Energy Locals is about 13c/kWh. That’s pretty good – especially compared to the 6-8c rate that was standard until about July this year. It’s also still only a small portion of what I’d save by using the solar energy directly – up to 42c/kWh during peak times (2pm-8pm). It’s a bit less than what I’d pay for grid electricity during shoulder times (7am-2pm), when the rate is about 20c/kWh.
Here’s where being on time of use (TOU) billing gets a bit tricky – especially without monitoring. Although I’ve got a vague idea, I’m not really clear on how much electricity I’m using during peak, shoulder or off-peak times.
At a minimum, by allowing all 20kWh or so of solar energy to go into the grid, I’d be earning about $2.60 in credits for the day – more than enough to cover the fixed $1.27 daily supply charge and a bit of the consumption charges.
As per the table below, I could theoretically save up to $6 for the day by using all the solar energy myself, but the actual story is more complicated than that. It doesn’t make any sense at all, for example, to consume electricity just for the sake of using it – only to shift usage that would happen anyway to the sunshine hours (e.g. dishwasher, washing machine, etc).
The best case scenario, therefore, is to minimise overall energy consumption as much as possible and use as much as possible into the daylight hours. The feed-in credits will help to eat into the bill. Ideally (although not particularly realistically), I could get my bill down to $0 with this approach – and let it be known that this is my goal!
More likely, however I’ll just manage to get it down to less than half of the $800 bill I received as a parting gift from my last residence (approximately $11/day). Looks like I could get close to that mark relatively easily by getting solar export down to 50%.
Table 1: Solar savings potential: Various feed-in vs self-consumption scenarios
| % solar exported to grid | Feed-in tariff revenues | Direct offset savings | Total solar value |
| 0% | Nil | ~$6.00 | ~$6.00 |
| 30% | ~$0.80 | ~$4.20 | ~$5.00 |
| 50% | ~$1.30 | ~$3.00 | ~$4.30 |
| 70% | ~$1.80 | ~$1.80 | ~$3.60 |
| 90% | ~$2.30 | ~$0.60 | ~$2.90 |
| 100% | ~$2.60 | Nil | ~$2.60 |
Monitoring progress
Which brings us back to the topic of monitoring. I’ve been in touch with folks from the three companies who will be installing monitoring/control software for me. I note that they’re essentially offering themselves up for science (or rather, blogging) and all of them are installing units for me at no cost or at a discounted rate. Otherwise there’s no way I’d be installing three different systems, as is my current plan.
Having them all in place, however, will allow me to work out how they differ from one another (for your edification, dear reader) – as well as what strategies work best for maximising solar savings.
Here’s where things are at with each of them.
carbonTRACK – hot water help is on its way
Earlier in the week carbonTRACK got in touch with me to let me know they’re sending someone out to install one of their monitoring/management hubs sometime this month (they’ve told me that installation & commissioning of the system will take about 2-3 hours). carbonTRACK’s technology has a focus on energy monitoring within a home’s ‘energy envelope’ (i.e. including energy consumption, solar production & battery performance).
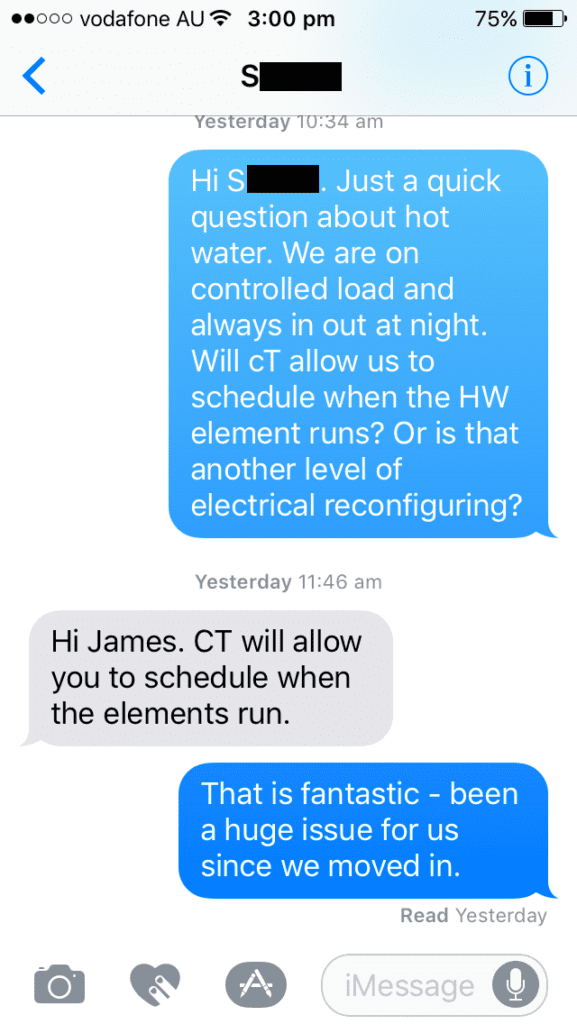
In addition to helping to solve the energy blindness issue, it turns out that they’ll also be able to help solve the hot water issue. I’ll be looking further how this change actually plays out with Ausgrid (the local network company) and Energy Locals (my retailer) in due time.
Solar Analytics install date (roughly) confirmed
Looks like Nigel from Solar Analytics will also be swinging by towards the end of the month to plug in the device that’s been staring at me from my desk. He’s told me that install & commissioning should take about 15 minutes.
Solar Analytics’ approach comes from the solar side of things, and I anticipate very detailed analysis of what my solar is doing and how I can make it work better from their platform. Their platform also allows for monitoring & gives insights into household energy consumption – and like carbonTRACK, it can also be installed on a home without solar, to help them work out their energy consumption patterns.
Reposit Power (Reposit First)
Reposit Power made a splash a few years back when they entered the energy space with a focus on battery storage system performance monitoring & control – particularly their GridCredits program, which rewards battery owners for selectively exporting energy to the grid.
More recently they’ve come out with a monitoring solution that can be put in before batteries (or even solar) are installed on the home – it’s aptly named ‘Reposit First’.
I’m not 100% sure when (or even if) I’ll be getting Reposit First installed, but I’m pretty keen on it as I do plan on putting in batteries at some point and from what I can tell it’s the best suited option for battery monitoring & control. Like the others, it’s possible that it could go in by the end of the month.
Also: Tadpoles
On a side note, one of the benefits of the two water features (aka ‘fountains’) in the back yard has become apparent: The larger one on the deck has managed to attract frogs to lay some eggs, which have now hatched into tadpoles. This has convinced me that running the fountain-powering pump – which keeps the water fresh & aerated – isn’t a complete waste of electricity.
Therein lie baby frogs (if you look carefully).
Join our mailing list to follow along
Get a free, instant solar & battery quote comparison
Compare Solar & Battery Quotes
© 2017 Solar Choice Pty Ltd
- Solar Power Wagga Wagga, NSW – Compare outputs, returns and installers - 13 March, 2025
- Monocrystalline vs Polycrystalline Solar Panels: Busting Myths - 11 November, 2024
- Solar Hot Water System: Everything You Need to Know - 27 February, 2024
