The winter solstice (21 June) has come and gone. With the shortest day of the year now behind us, it’s all up from here, but we’ve still got a while to go before we’re back to the sunshine-filled days of summer. What do solar system owners need to know in the meantime?
What happens to solar energy production in the winter?
There are primarily two things to look out for when it comes to solar system performance in the winter months:
- Solar PV systems produce less energy on average per day due mainly to fewer hours of daylight (aside from more frequent inclement/overcast weather); the further towards the poles you live the more exaggerated this effect becomes (sorry, Tasmania), while the closer to the equator you are the less pronounced it is (e.g. Darwin).
- Shadows get longer due to the sun’s lower position in the sky, which means that you’re more likely to having shading issues during the winter than the summer.
I’ve been witnessing both of these ‘winter effects’ occur in in my own home – and have written about the experience a bit in this article.
See also: Making the most of your solar in the winter (printable table)
Compare Solar & Battery Quotes
Lower overall solar production
Unsurprisingly, 21 June was one of the worst days of solar energy production from my solar system(s) since I moved in, with only 5.2kWh of energy produced – due to the compound effect of low amounts of sunlight coupled with rainy weather in Newcastle.
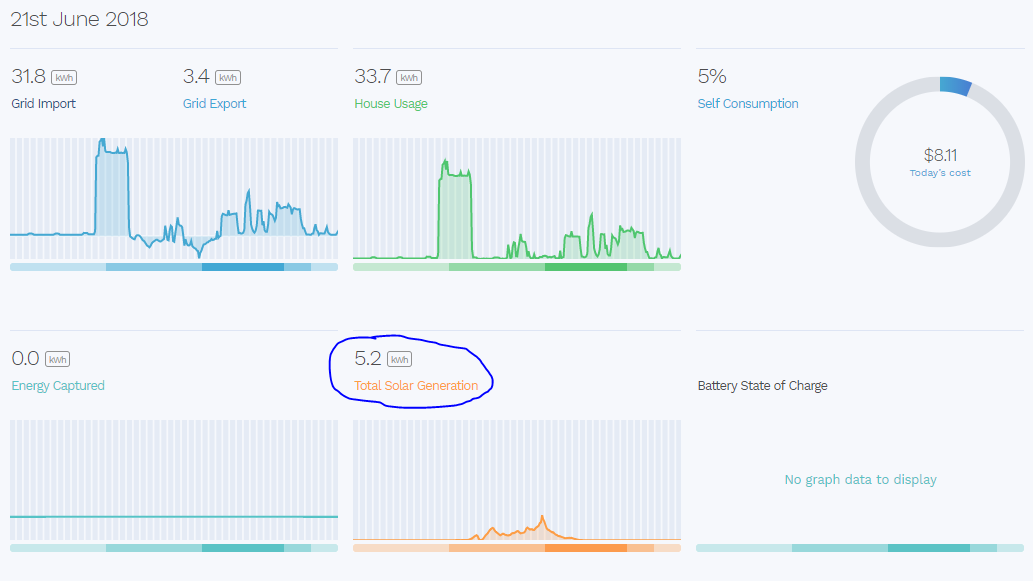
Energy usage & production overview from Reposit for my house on 21 June – the shortest day of the year.
Of course, we had been buffeted with days on days of rainy weather around that time. If not for the pesky clouds getting in between my solar panels and the sun, I would have produced closer to 20kWh for the day – as I have been on sunnier days in the same week. By contrast, we were producing nearly 30kWh during clear days in the summer.
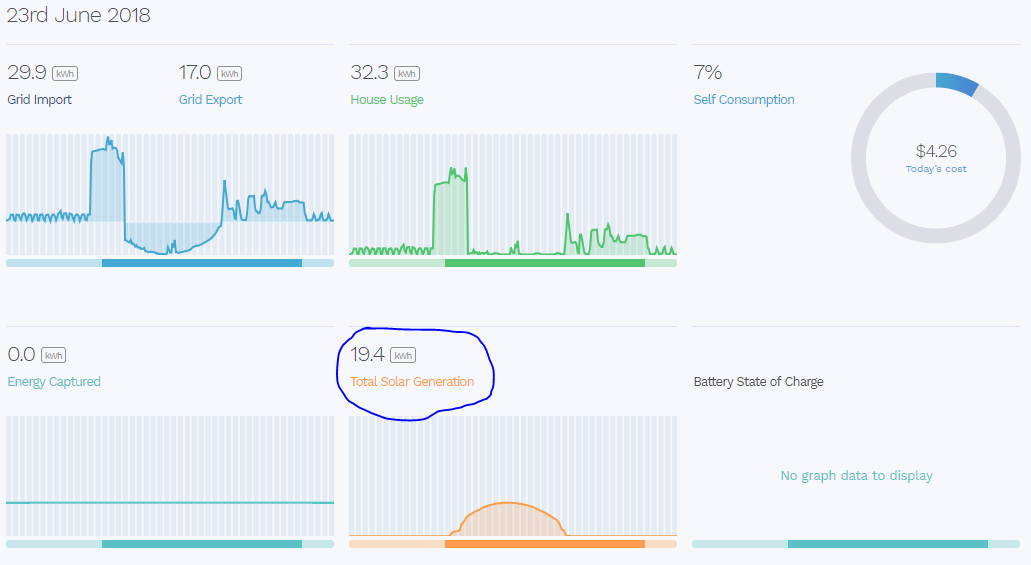
Energy usage & production two days later on 23 June – quite a difference, with nearly 20kWh produced.
How much energy can you expect from your solar system in winter?
The table below offers a rough overview of average, high & low daily solar radiation levels (kWh/m2) for each Australian capital city. The ‘low’ figures are the typical average for May, June or July (whichever was lowest) as per outputs from the PVWatts calculator tool.
Basically, these numbers show how many kilowatt-hours (kWh) a perfectly efficient 1 kilowatt (kW) solar system will produce in perfect conditions (tilt angle, orientation, etc). Think of these numbers as the ‘raw solar fuel’ for a solar PV system to turn into energy – how much is actually produced will depend on the size of the system and the conversion efficiency of the system as a whole (typically 75-80%).
| City | Average daily solar radiation (kWh/m2) | Lowest daily solar radiation level (kWh/m2, winter) | Highest daily solar radiation level (kWh/m2, summer) |
| Adelaide, SA | 5.5 | 3.1 | 7.6 |
| Brisbane, QLD | 5.4 | 4.1 | 6.1 |
| Canberra, ACT | 5.5 | 3.4 | 7.4 |
| Darwin, NT | 5.8 | 6.3 | 4.9 |
| Hobart, TAS | 4.4 | 2.3 | 6.2 |
| Melbourne, VIC | 4.8 | 2.9 | 6.7 |
| Perth, WA | 5.8 | 4.1 | 7.5 |
| Sydney, NSW | 5.9 | 3.5 | 6.0 |
Impacts of shading in winter
My solar system is also afflicted by the winter shading problem, although not particularly badly (anymore – keep reading). The chart below (from Solar Analytics) shows where shading begins to affect the two arrays – in the morning due to a neighbour’s tree to the east and in the afternoon due to the house to the west (which is higher up on the hill).
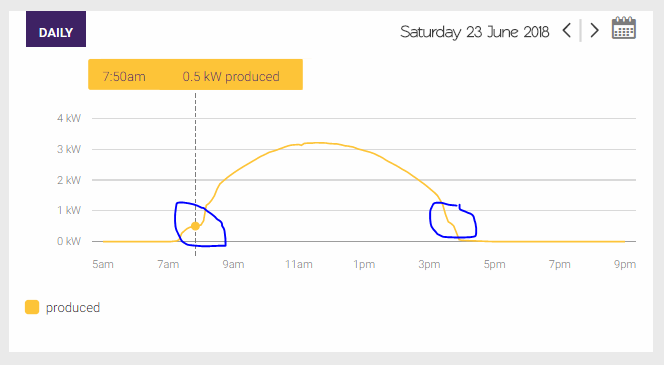
Shading impacts from objects in neighbouring yards in the morning and afternoon (in Solar Analytics). These dips don’t occur in summer.
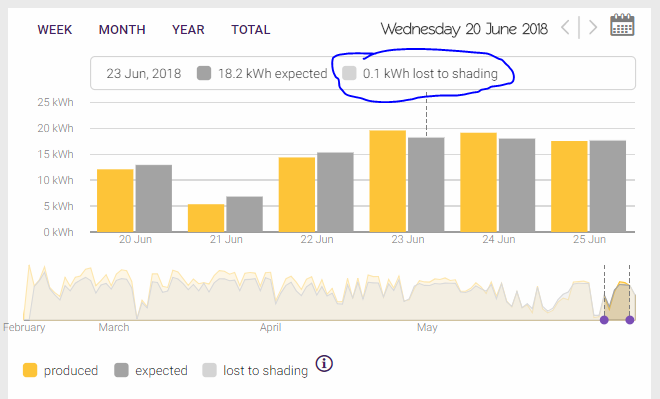
Solar Analytics tells me I’m losing about 0.1kWh of solar production due to shading, but also tells me that my system is generating more than the ‘expected’ amount – so I’m not really sure what to think!
When I first moved in, there were two very tall palm trees in the back yard that were having an even more noticeable shading impact on the solar arrays during the winter months. Below is a screenshot from May 2017 (via Nearmap).

BEFORE: Shadow on the roof cast by trees in the back yard during the winter months before we moved in – they didn’t cause a problem the rest of the year. We’ve since removed the palm trees (and I have no idea if the previous owners were even aware of how bad it was!)
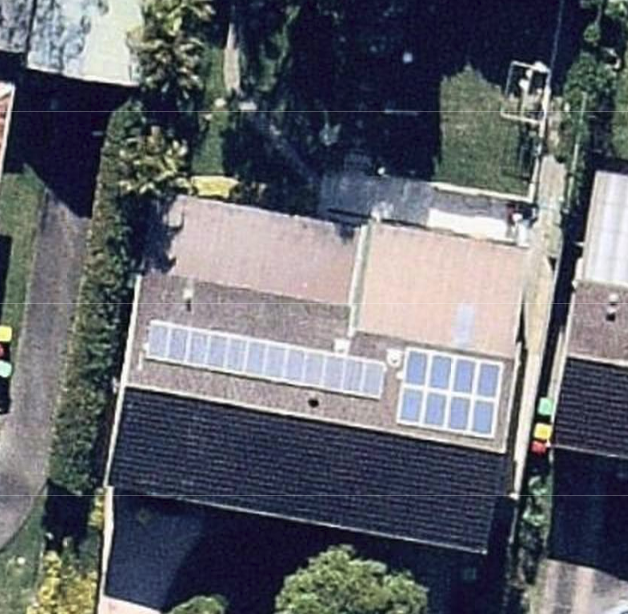
AFTER: We’ve since had the palm trees removed (they are classed as a weed in NSW anyhow), which eliminated the previous shading issues.
Energy consumption in the wintertime
Every household has different energy consumption habits, and this winter has been all about learning what mine are.
One of the biggest factors influencing winter electricity bills is the home’s method(s) of heating. For us, the main heat source is a ducted air conditioning unit that is about twenty years old, which makes it something of a dinosaur to run – and run it we do. On top of that, in the evenings we also use a radiant heater in the living room and an oil heater in the main bedroom.
In my inefficient electric home, having a three year old means we’re often up (and very cold) before the sun in the winter. Switching the AC on for just an hour or two a day (mostly during off-peak rate times, mind you) has resulted in a dramatic leap in our energy consumption (often over 30kWh/day as opposed to less than 10kWh/day) and only seldom is there a significant overlap with solar generation. In fact, Solar Analytics has been sending me notifications basically telling me what a bad job I’m doing compared to my neighbours with solar.
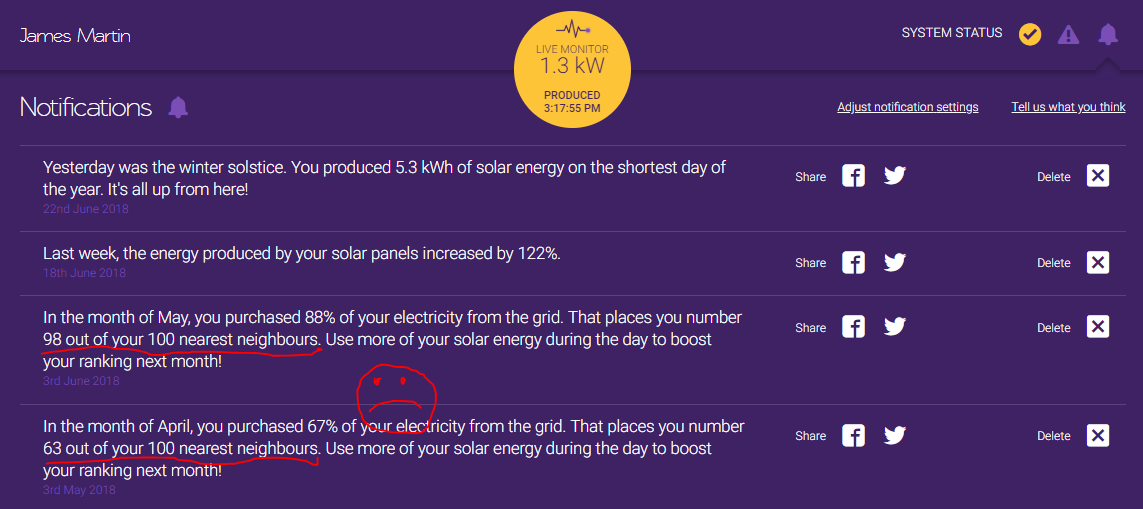
Solar Analytics letting me know that I need to do a better job of shifting energy usage to daylight hours. This is tough when our greatest need for heating is in early morning and evenings.
This is showing in our electricity bill estimates – June 2018 is already our most expensive month yet (and we still have a few days left to go). This is a total back flip from the abundant summer months, when my home was net energy positive on more or less a daily basis – and our energy costs were close to zero after counting solar feed-in tariff credits.
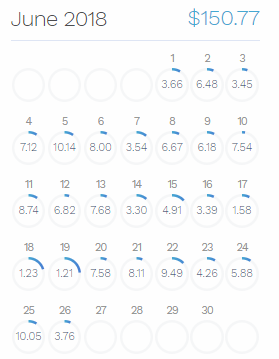
Energy costs so far this month (excluding water heating) as per Reposit. The blue partial circles indicate the percentage of our energy needs met directly by solar.
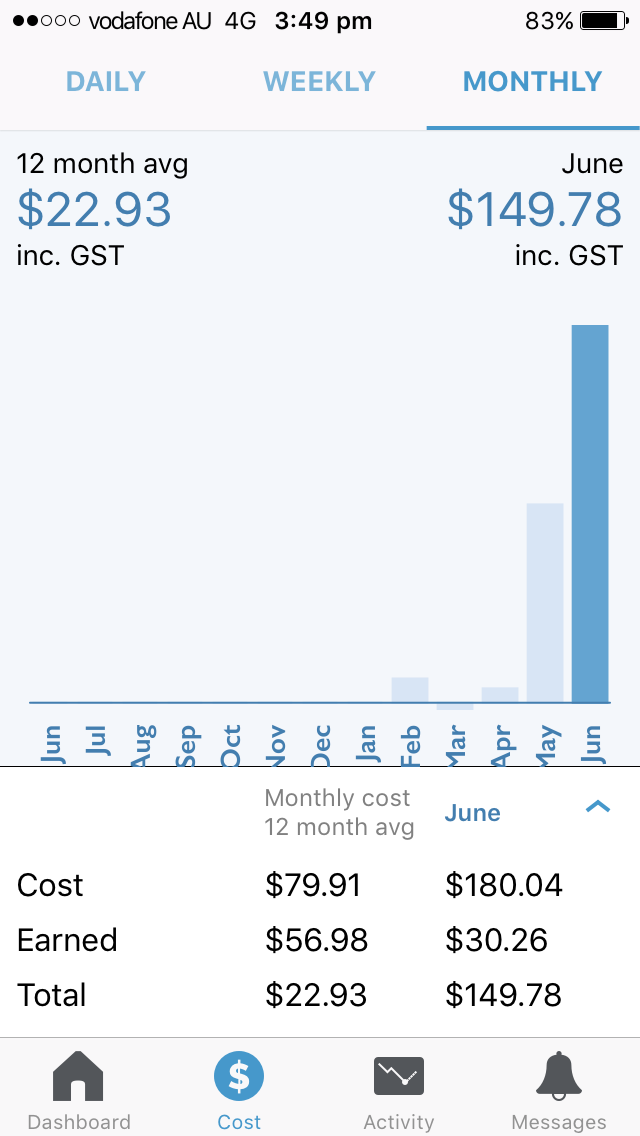
Electricity charges & credits for June 2018 (so far) vs my home’s average to date (as per Reposit). Shorter days and lots of rain mean that feed-in credits for the whole of the month have so far amounted to about $30 – as opposed to about $60 in March (our best month so far).
As someone who works in the solar industry, I’m not exactly proud of these figures. Shouldn’t I be in the top 10 solar households in my area according to Solar Analytics? For the time being, I’m looking at this winter as a learning experience – with improvements (such as underfloor insulation and a new air conditioning unit!) coming in when time & budget allow.
Join our mailing list to follow along
Get a free, instant solar & battery quote comparison
Compare Solar & Battery Quotes

- Why a big battery could be cheaper than a small battery with the federal rebate? - 19 June, 2025
- Heat Pump Costs – Solar Choice Price Index - 1 June, 2025
- Solar Panel Costs: Solar Choice Price Index | July 2025 - 1 June, 2025