Welcome to the second edition of Solar Choice’s Battery Storage Price Index – the companion to our Solar PV Price Index, which covers solar system installation prices around Australia. The aim of the Battery Storage Price Index is to assist you in determining whether batteries are right for your home.
Average battery system prices for the month of December have dropped slightly from November, at about $1,710 per kilowatt-hour (kWh) of storage across a range of system sizes (due mainly to more mid-range products having been added to the database). The low remains steady at $870/kWh.
Important note: None of the prices & costs detailed below include the installation of a solar system. For current solar system prices, please visit our Current Solar System Prices page.
You can also instantly compare solar & battery quotes for your area by filling out the form on this page:
Compare Solar & Battery Quotes
Average out-of-pocket battery installation prices – December 2017
The table below displays average, indicative battery installation prices from a range of installers around Australia, most of whom are active in the Solar Choice network. Prices include installation and GST.
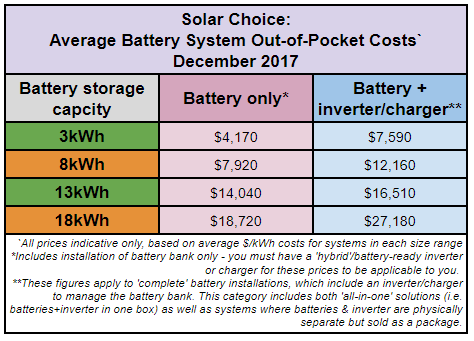
Click to enlarge.
Not sure what battery size is right for your home? Check out our Quick Guide to Sizing Residential Solar & Battery Systems
IMPORTANT: Further info, assumptions & explanations (click to expand) ▼
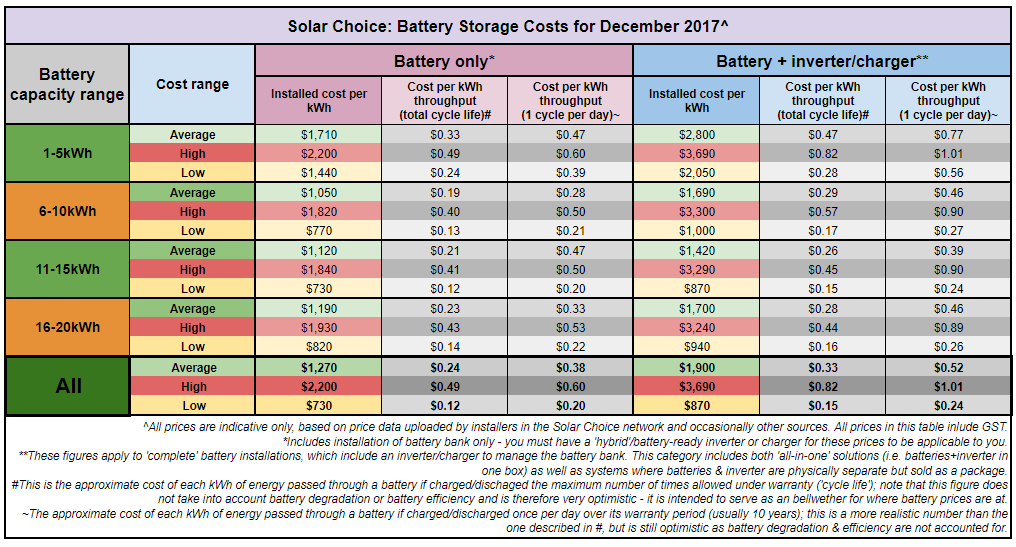
Average, high & low battery installation prices – December 2017
The table below is pretty information-dense, so make sure that you read the footnotes and the text below.
Click to enlarge.
In this table we try to take a holistic approach to representing battery value. When comparing battery systems, people in the industry typically speak in terms of ‘dollars per kilowatt-hour’ ($/kWh) of storage capacity. This is an easy shortcut for discussing battery value (which is why we’ve included it), but doesn’t tell the full story as different batteries can tolerate different levels of use. For example, some batteries may only be charged/discharged (‘cycled’) once daily, while others can by cycled up to 2.7x per day (see: sonnen) without voiding the warranty.
To this end, we’ve also included figures on ‘energy throughput‘. The energy throughput metric gives you an idea of how much you’ll pay for each kWh of energy that you pass through the battery over its lifespan.
We’ve looked at two scenarios:
- If you cycle the battery as many times as its cycle life will allow per day (total cycle life), or
- If you cycle it only once per day (which is the more realistic scenario since most homes will charge their batteries only with the sun and not with the grid – c.f. tariff arbitrage).
As noted in the footnotes of the image above, these figures are highly indicative and are intended to serve as a means of comparison between battery products – they do not take into account battery degradation or efficiency.
Compare Solar & Battery Quotes
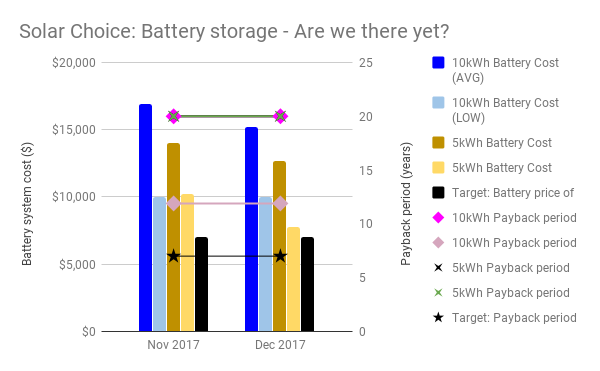
The ‘Are we there yet?’ Meter

Despite their growing popularity, the vast majority of the almost 2 million households with solar panels in Australia do not have batteries. As battery technology costs fall, battery storage will become more financially attractive and the number of battery installations will increase.
The ‘Are we there yet?’ Meter (the chart below) gauges the overall attractiveness of home battery storage in Australia.. We look at the national average & low battery prices for moderately-sized (5kWh & 10kWh) ‘full’ battery systems (not a specific product, but more an amalgamation of various products that we’ve seen) and see how the estimated payback periods stack up against a theoretical ‘ideal’ payback period of 7 years; we see this 7 year mark as being a reasonable marker of the battery market being where it needs to be to make sense for most households (the ‘there’ in ‘are we there yet?’).
IMPORTANT: More about battery prices & payback periods (click to expand) ▼
So is battery storage there yet?
At just over $1,000/kWh for systems on the ‘low’ end of the price spectrum, and with payback periods coming in at just over 10 years, we’re close enough for lots of Australians to justify making an investment in batteries to themselves (as many already are) but not yet in the territory of ‘mass appeal’.
Remember that this chart is meant to reflect the national situation as an amalgamated whole – your individual circumstances (including the state you live in, the amount you pay for electricity & the deal you get on a battery system) may be conducive to shorter payback systems, so we encourage you to look into it for yourself.
(You can get battery system pricing by requesting a Quote Comparison through our system. You can evaluate battery viability for your situation using our Solar & Battery Storage Sizing & Payback Estimator Tool.)
Click to enlarge.
About this data
Tables and charts included in this article were compiled using data from Solar Choice’s installer network database (as well as a couple of outside sources), which contains regularly-updated pricing and product details from over 100 solar & battery installation companies across Australia. Prices do not ordinarily incorporate meter installation fees or additional costs for difficult installations.
Compare Solar & Battery Quotes
© 2019 Solar Choice Pty Ltd

- Solar Power Wagga Wagga, NSW – Compare outputs, returns and installers - 13 March, 2025
- Monocrystalline vs Polycrystalline Solar Panels: Busting Myths - 11 November, 2024
- Solar Hot Water System: Everything You Need to Know - 27 February, 2024